Every program watches its critical path. Almost nobody watches the paths behind it, and those are the paths that will set your date. We have written before that the path that bites is usually the one you were not watching, and that it is the second or third critical path that sneaks up on a program. This article puts numbers on those sentences. The instrument is a critical path analysis generated by fastProject, and the concept at its center is buffer erosion: measuring, in days per week, how fast every path behind the critical path is becoming the critical path. The full report, client identifiers removed, is the download at the end.
The vocabulary is short. CP1 is the critical path, the longest chain of work in the program. CP2 through CP10 are the next-longest chains, and each carries a buffer: the number of days it sits behind CP1. A path with 15 days of buffer can lose 15 days before it starts setting your finish date. FTTM means accelerating CP1 through CP10, not CP1 alone, because the moment a near path’s buffer hits zero, it is the critical path, and your acceleration is working on the wrong chain.
Buffers close from both sides
Here is the part most programs miss. A near path’s buffer erodes at the sum of two rates: its own slip rate, plus CP1’s pull-in rate. Both ends of the bar are moving. When the team accelerates CP1, every buffer behind it shrinks by exactly that much, so a near path does not have to slip at all to go critical. On the program in the report, CP1 was pulling in about 11 days per week, which means a perfectly stable near path was losing 11 days of buffer per week while doing nothing wrong.
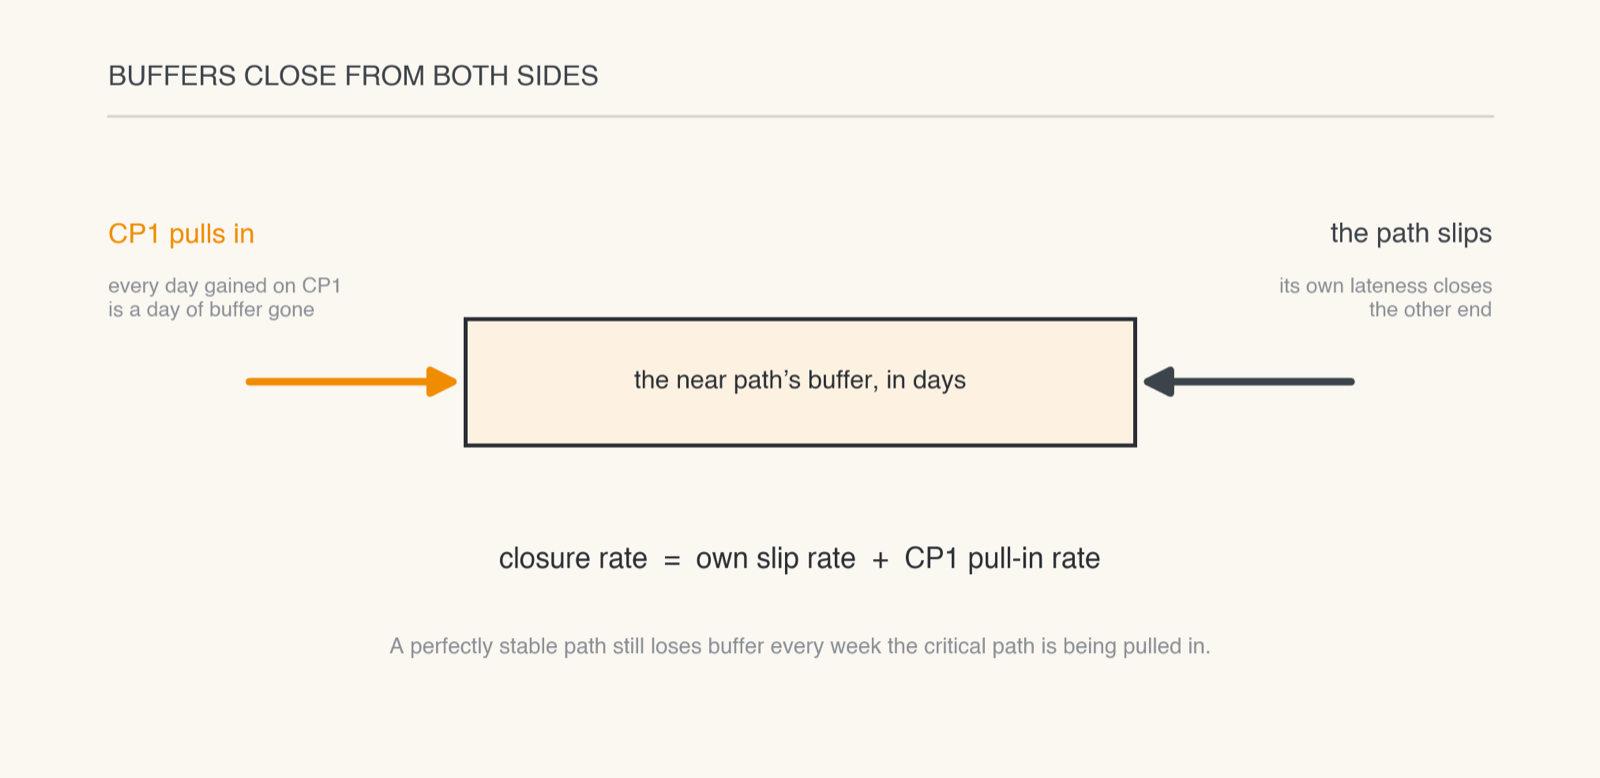
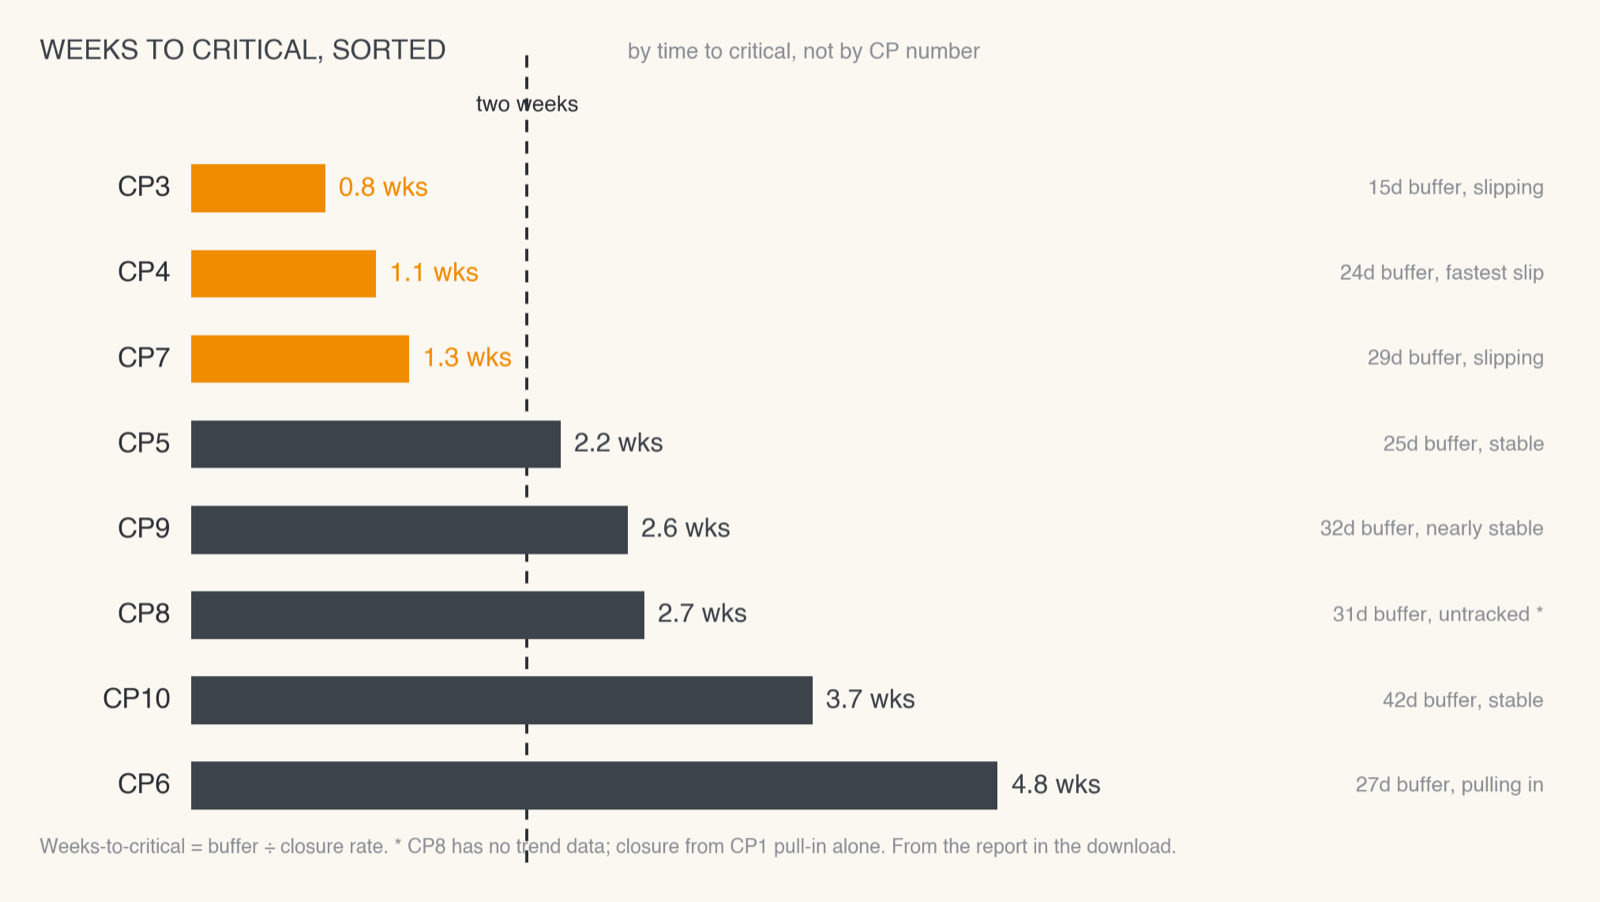
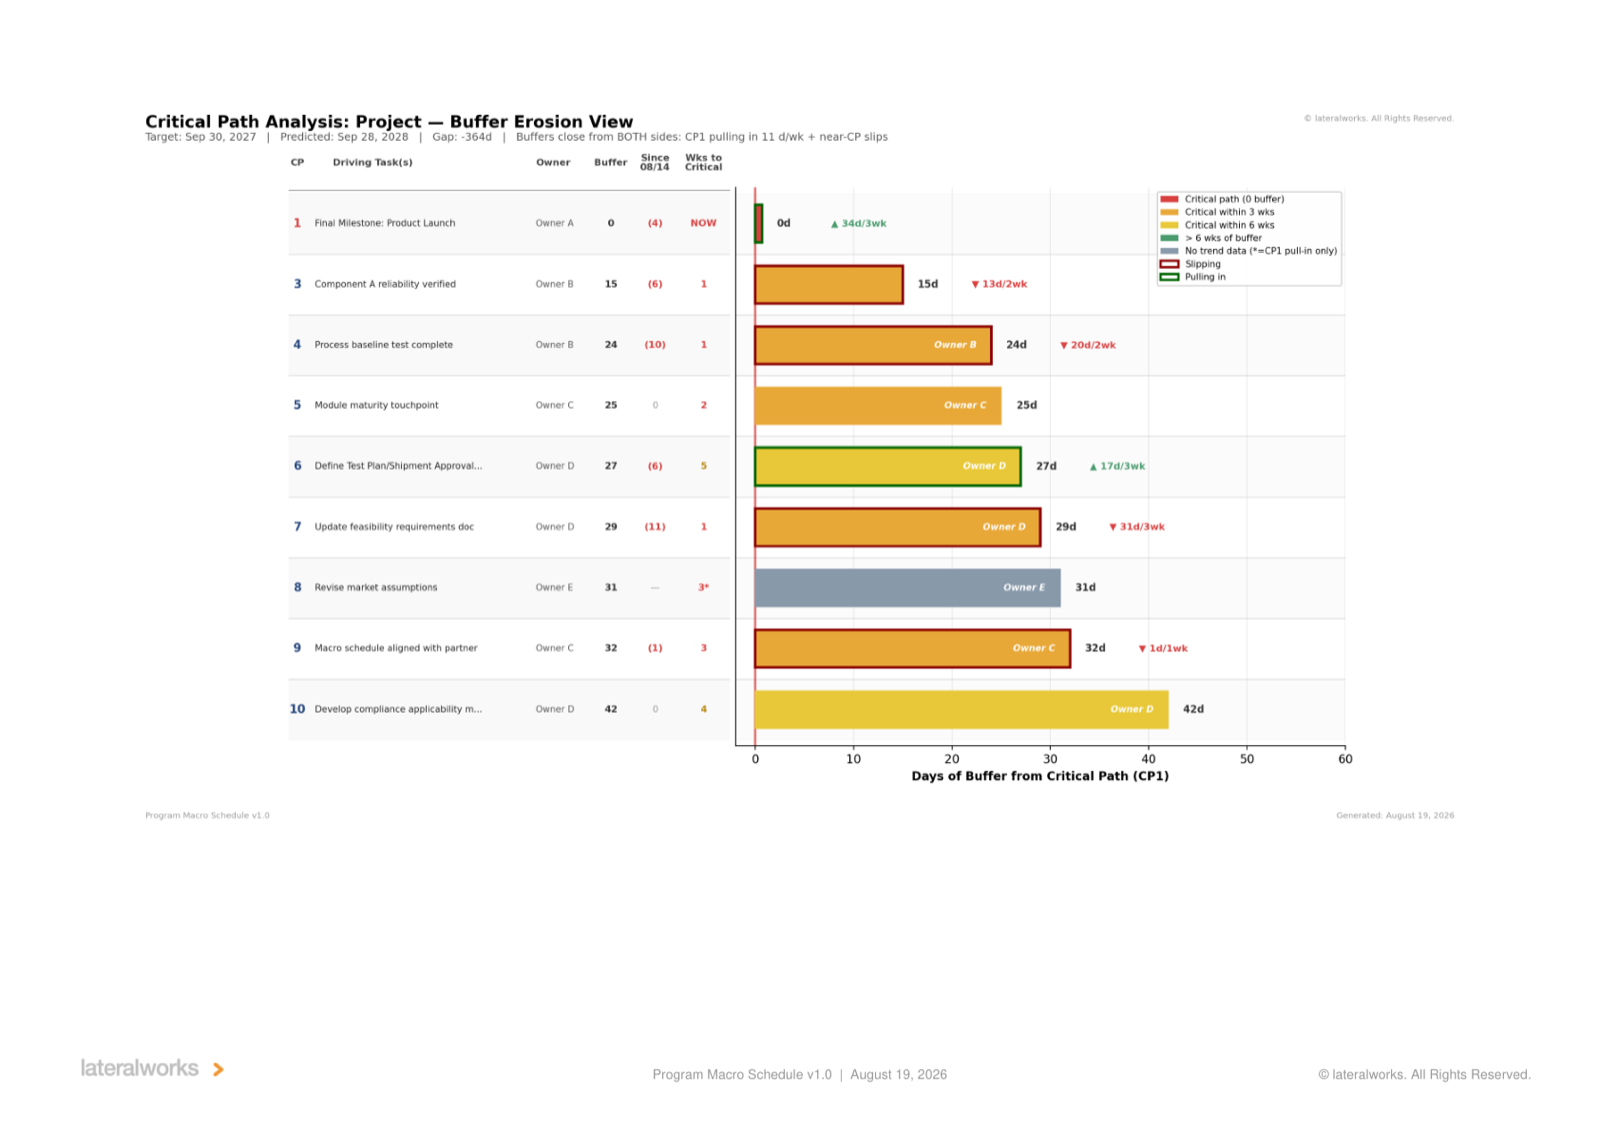
Run the arithmetic on the sharpest case. CP3 held 15 days of buffer and was slipping 6.5 days per week. Add CP1’s 11-day pull-in rate and that buffer was closing at 17.8 days per week: critical in under a week. CP4 was slipping 10 days per week, the fastest slip on the program: critical in about a week. CP7 held 29 days, more buffer than either, and was still only nine days from critical. Meanwhile the chart everyone was celebrating showed CP1 pulled in 34 days over three weeks, the first sustained recovery on the program. The same force behind that recovery was draining every buffer behind it. A pull-in on CP1 is also a countdown clock for every path behind it.
The number that matters is weeks-to-critical
Sort the paths by buffer size and you will worry about the wrong ones. The CP numbers themselves are the buffer order: CP5 holds less buffer than CP7, which holds less than CP10. Sort by weeks-to-critical instead, the buffer divided by its closure rate, and the list reorders itself. On this program, CP6 held 27 days of buffer and sat almost five weeks from critical, because it was pulling in on its own. CP5 held 25 days, was perfectly stable, and sat two weeks from critical, because stability is not safety while CP1 is moving. And one path had no trend data at all: 31 days of buffer, nobody tracking it. An untracked path is not a safe path. It is a surprise on a timer.
What the recovery bought, and what protects it
The report’s sharpest finding is a paradox: the recovery caps itself. Unless the slips behind CP1 stop, every additional day pulled in on CP1 stops shortening the project within about a week, because CP3, CP4, and CP7 become the constraint. Thirty-four days of gain, and the program keeps only what the paths behind CP1 allow it to keep.
The leverage was just as concrete. Two of the three fastest-closing paths ran through the same owner and were blocked by the same two overdue supplier documents. Delivering those two documents that week was the single highest-leverage action on the program: one action, two paths unblocked, 34 days of recovery defended.
A second program, with more history
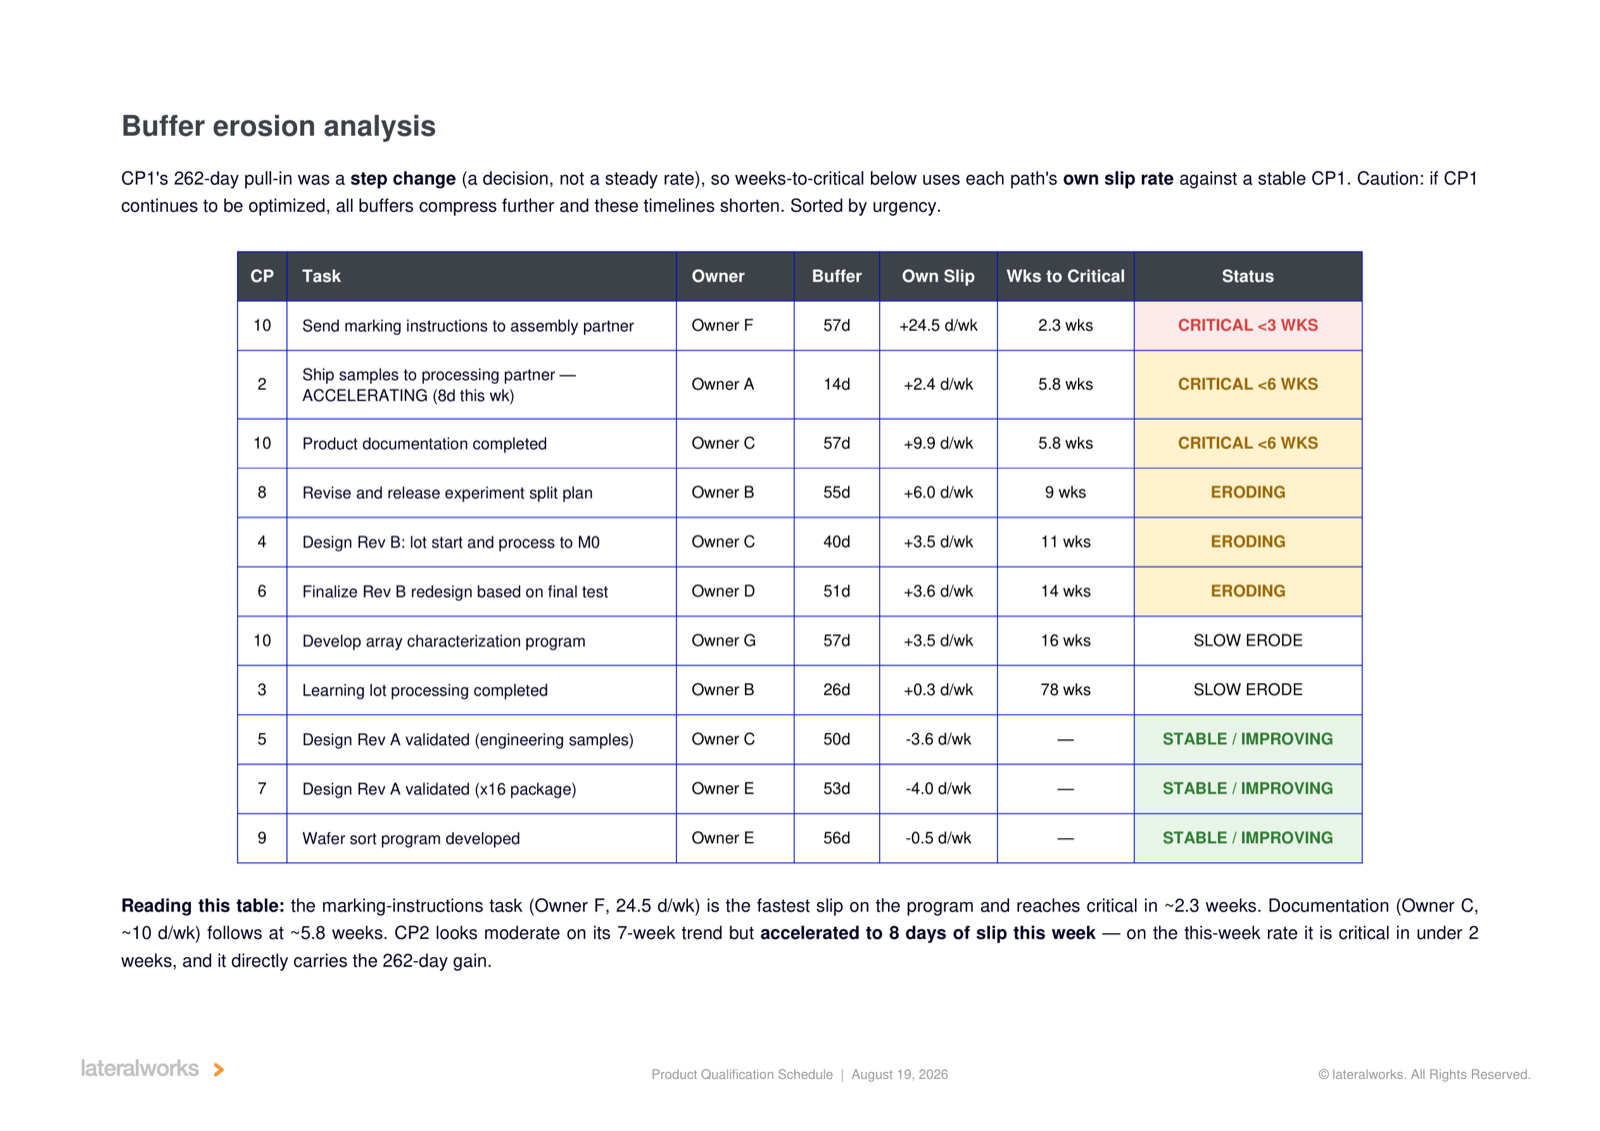
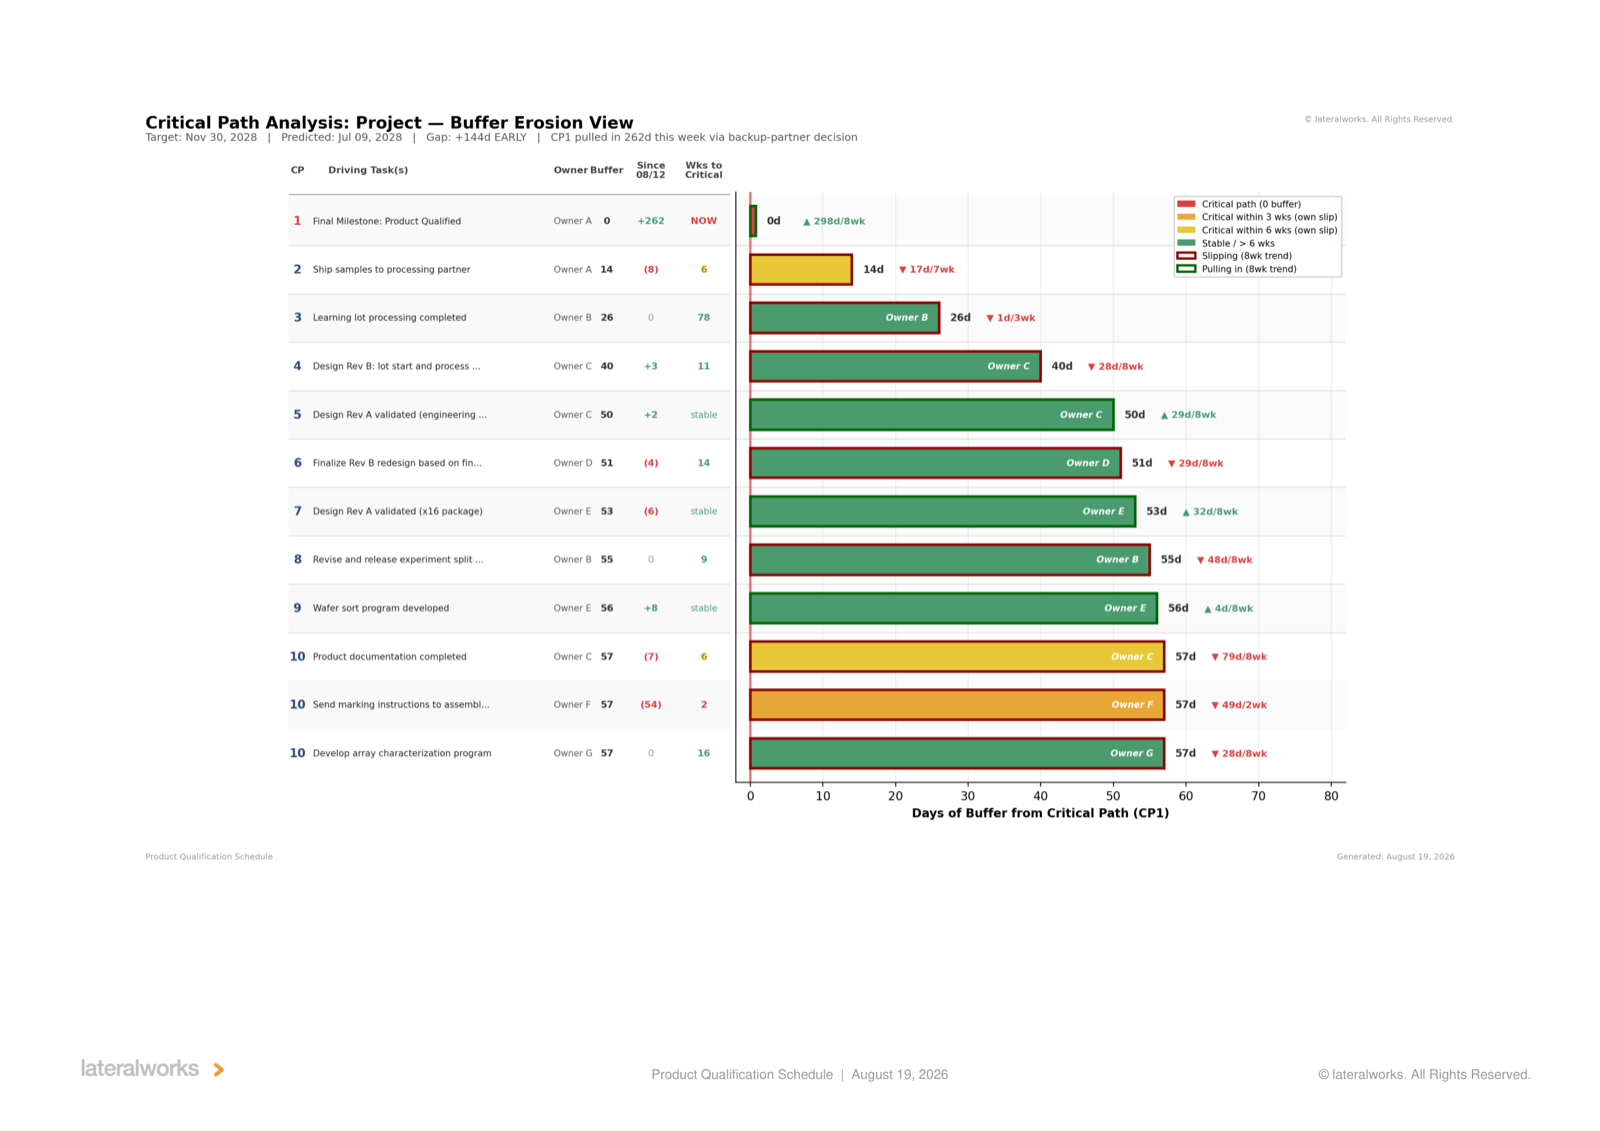
The report above catches a program a few weeks into tracking. The second download is a different program, a product qualification effort tracked for about six months, and the longer history shows things a few weeks cannot. The headline: in one week, CP1 pulled in 262 days. Not a trend maturing, a decision landing. The team chose to qualify a backup processing partner in parallel instead of waiting in line for the primary, the schedule logic rewired overnight, and the predicted finish jumped from behind target to 144 days ahead of it. Over eight weeks the program recovered nearly 300 days. Big pull-ins are bought by decisions, not by effort.
Then the erosion math takes over, and this is the part to study. The entire 144-day gain hangs on CP2, which now sits 14 days behind the new critical path. The week of the pull-in, CP2 slipped 8 days, more than three times its six-month trend, and it is accelerating. Every day CP2 slips beyond those 14 gives the recovery back, day for day. The parallel-partner decision that produced the gain also had one action still open when the report was cut, which makes the gain provisional twice over: fragile at CP2, and unconfirmed at its source.
The six months of history also sharpens the method. When CP1 moves as a step change, a decision that will not repeat weekly, adding its pull-in rate to every near path would overstate the erosion. So the weeks-to-critical math shifts to each path’s own slip rate against the new, stable CP1. Same principle as figure 1, applied with judgment: the question is always what is actually closing the buffer this week.
And the back of the pack races forward. The fastest slip on the program was on CP10: 49 days in two weeks, roughly 24 days per week, putting the tenth path about two weeks from critical on a program that just got 144 days healthier. Two more paths were closing at 10 and 6 days per week, and three of the fastest-closing chains ran through a single owner, which is the report’s quiet finding about load. The defensive principle from the first report applies in reverse here: a large pull-in on CP1 makes every path behind it relatively closer to critical. The bigger the win, the thinner the moat, and six months of data show both sides of that trade in the same table.
The practice
None of this is assembled by hand. fastProject computes CP1 through CP10, the buffers, the slip rates, the closure rates, and the weeks-to-critical from the live schedule at every weekly refresh; the report in the download is the export. The team’s job is the review: a weekly buffer-erosion pass over the weeks-to-critical table, a pull-in proposed on anything inside two weeks, a tracker put on anything untracked, and a cause on every move. Goldratt made buffer management famous in Critical Chain (1997). The difference here is the second clock. His buffers protect a program against its own slips; buffer erosion also counts the days your own success on CP1 is taking away from every path behind it.
Where the program is about to be
The gap and the trend tell you whether the program is winning. Buffer erosion tells you who sets the date next. Watch CP1 to go fast; watch CP2 through CP10 to stay fast. The path that bites is still the one you were not watching. Buffer erosion is how you watch all ten at once, in days, before any of them bites.
Related reading: The critical path you’re not watching, It’s the second or third critical path that can sneak up and bite you…, Positive vs Negative Buffer (i.e. Margin), Pull-in before you slip, Schedule gap, The weekly schedule refresh, Targets and Trends, and How lateralworks uses AI.