Two product schedules, one contract manufacturer. A sensor family with three variants, a handheld with two, both built by the same ODM, an original design manufacturer, both carrying home market targets in month 9. Each plan is reasonable on its own. Sum what they ask of the ODM week by week and a different picture appears: ten FTE at the month-5 peak, 4.2 EE and firmware engineers demanded against three named in the files, and a mechanical pinch that is not coming, it is already under way. Nobody had asked the obvious question, can the partner staff both at once, because answering it by hand is the kind of spreadsheet project nobody starts. This study took three minutes.
The two projects are the leading edge of a bigger question. The client plans fifteen new products launching incrementally over two years, with four ODMs in line to build them. The portfolio problem statement is three questions:
The portfolio problem statement
1. Can the ODMs support this level of design and production work?
2. What resources would each ODM need to mobilize, and when?
3. How many products should go to each ODM?
There is an acceleration scenario on the table too: compress the market analysis and product definition work up front and all fifteen products pull forward, which steepens every demand curve at once. Nobody allocates fifteen products across four factories on instinct. So the study starts small on purpose: the first two products, one ODM, an order-of-magnitude answer built from the two fastProjectAI schedule files in minutes, which tells the client whether the allocation question can be answered this way at all. It can.
The inputs were already sitting there. The two native Microsoft Project schedules, maintained in fastProjectAI and refreshed weekly by the core teams. The client's historical resourcing data and estimates, saved in a Claude Project folder from earlier work. Claude classed every ODM-owned task in both schedules, the detail rows where the work actually sits, not the summary bars above them, into a resource type, applied an FTE rule per task class, and summed the overlapping tasks by calendar week. No leveling was applied, and the brief says so on its face: the histogram shows demand, not a plan. That honesty is the point. Before anyone negotiates, both sides should see what the saved plans actually ask for.
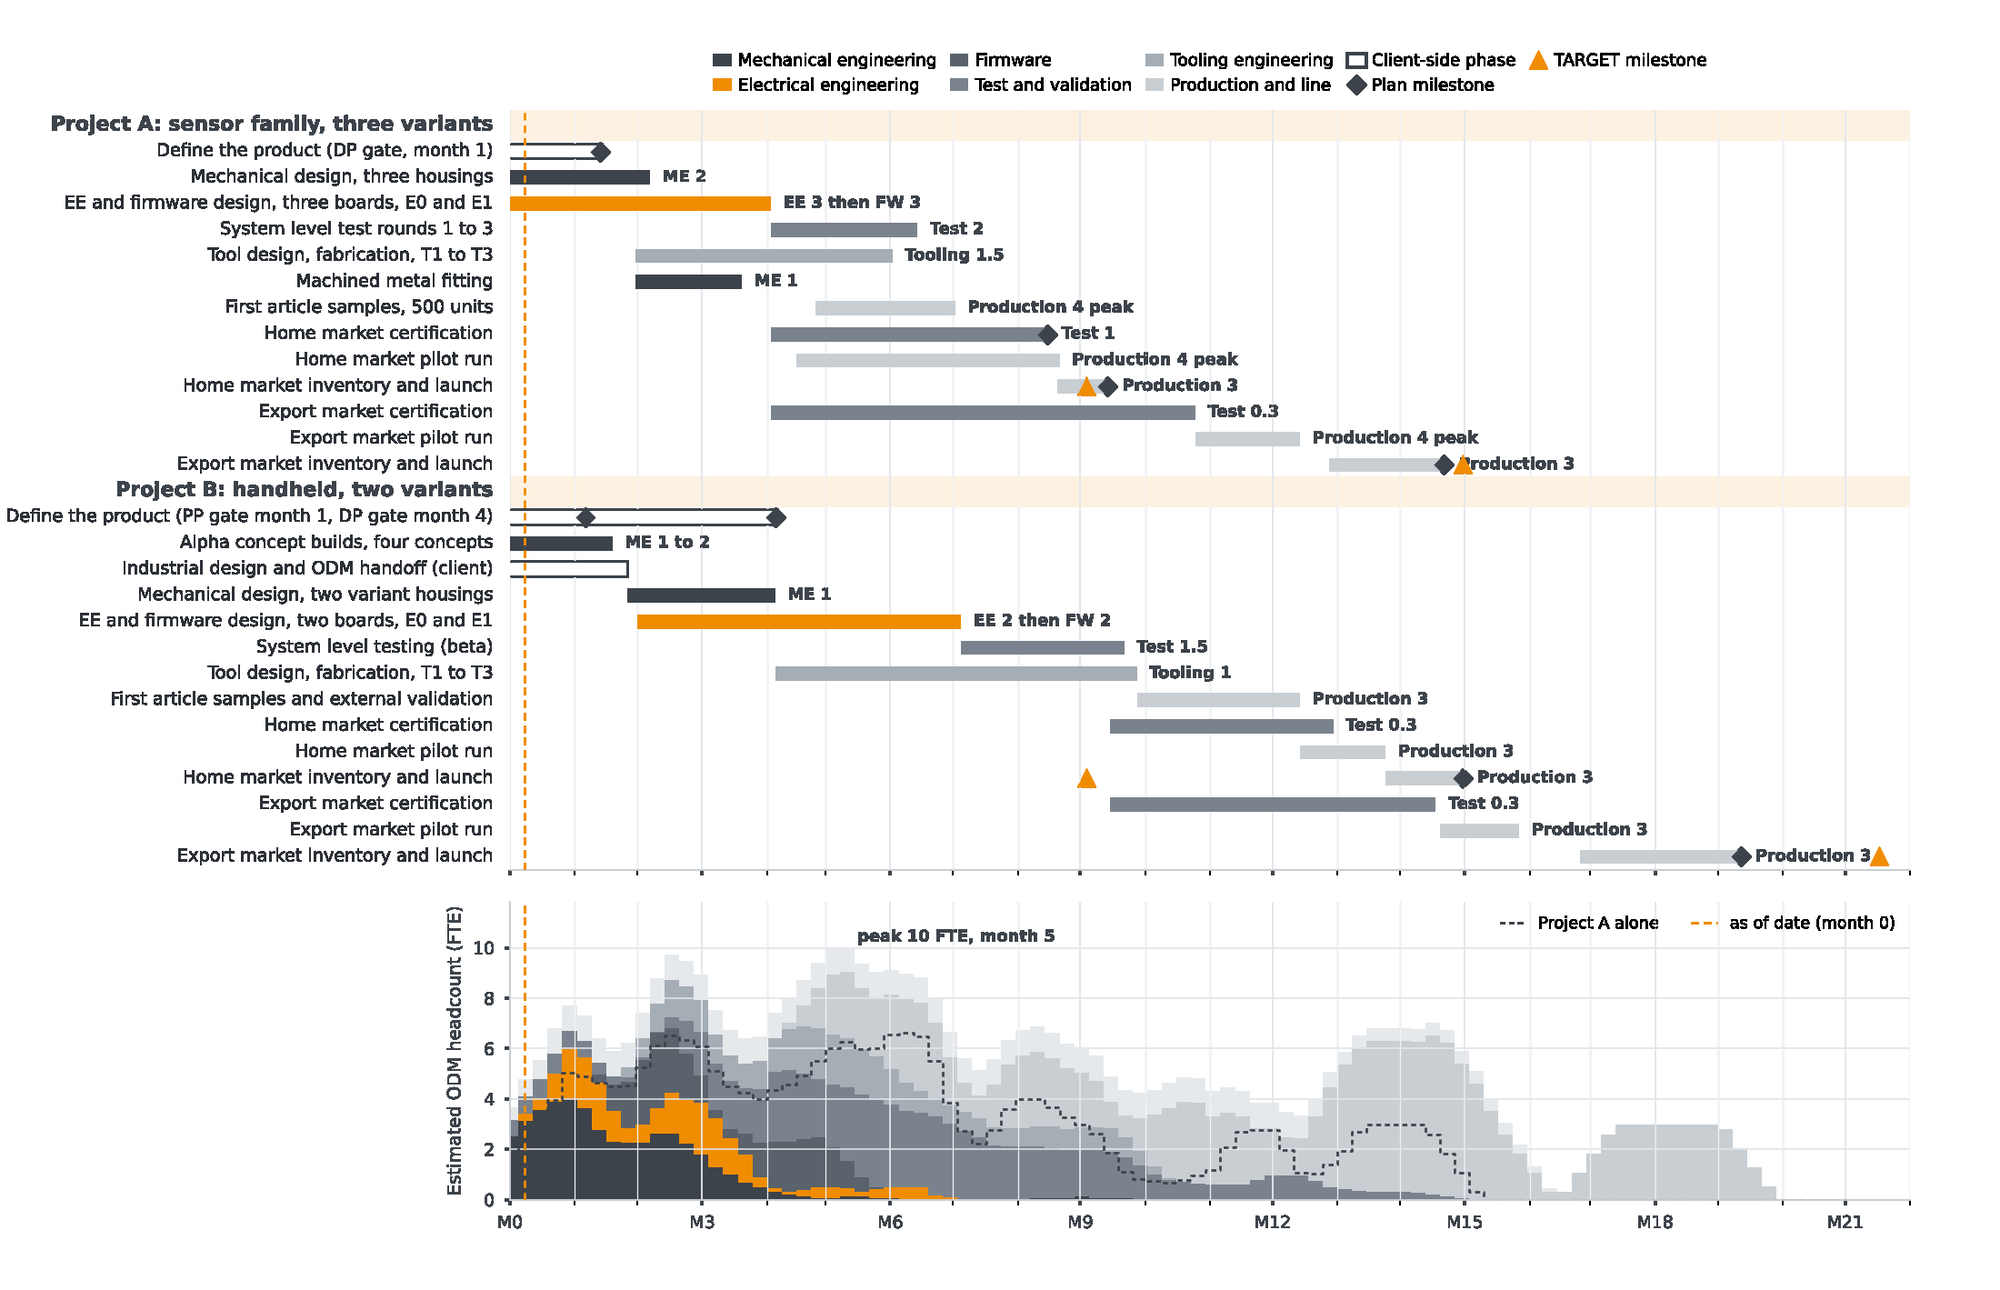
Four pressure points, sized and dated
The brief reduces 551 tasks across the two files to four findings. EE and firmware is the collision that matters: 4.2 engineers needed across weeks 8 to 12 against three named, a shortfall of 1.2 FTE for five weeks, under half a person-year. Mechanical engineering is squeezed now, not later: demand peaks at 4.0 FTE in month 1 against two named engineers, because three housings, four alpha concepts and two variant housings share the same eight weeks. Production stacks in months 12 to 16, peaking at 6.3 line FTE in month 14, which is schedulable work that needs a line allocation agreement, not more engineers. And tooling is a lead-time problem, not a headcount problem: tooling engineering never exceeds 2.0 FTE, but the handheld's tool design starts the day its DP gate closes, so any gate slip moves tooling, first article samples and the home market launch one for one.
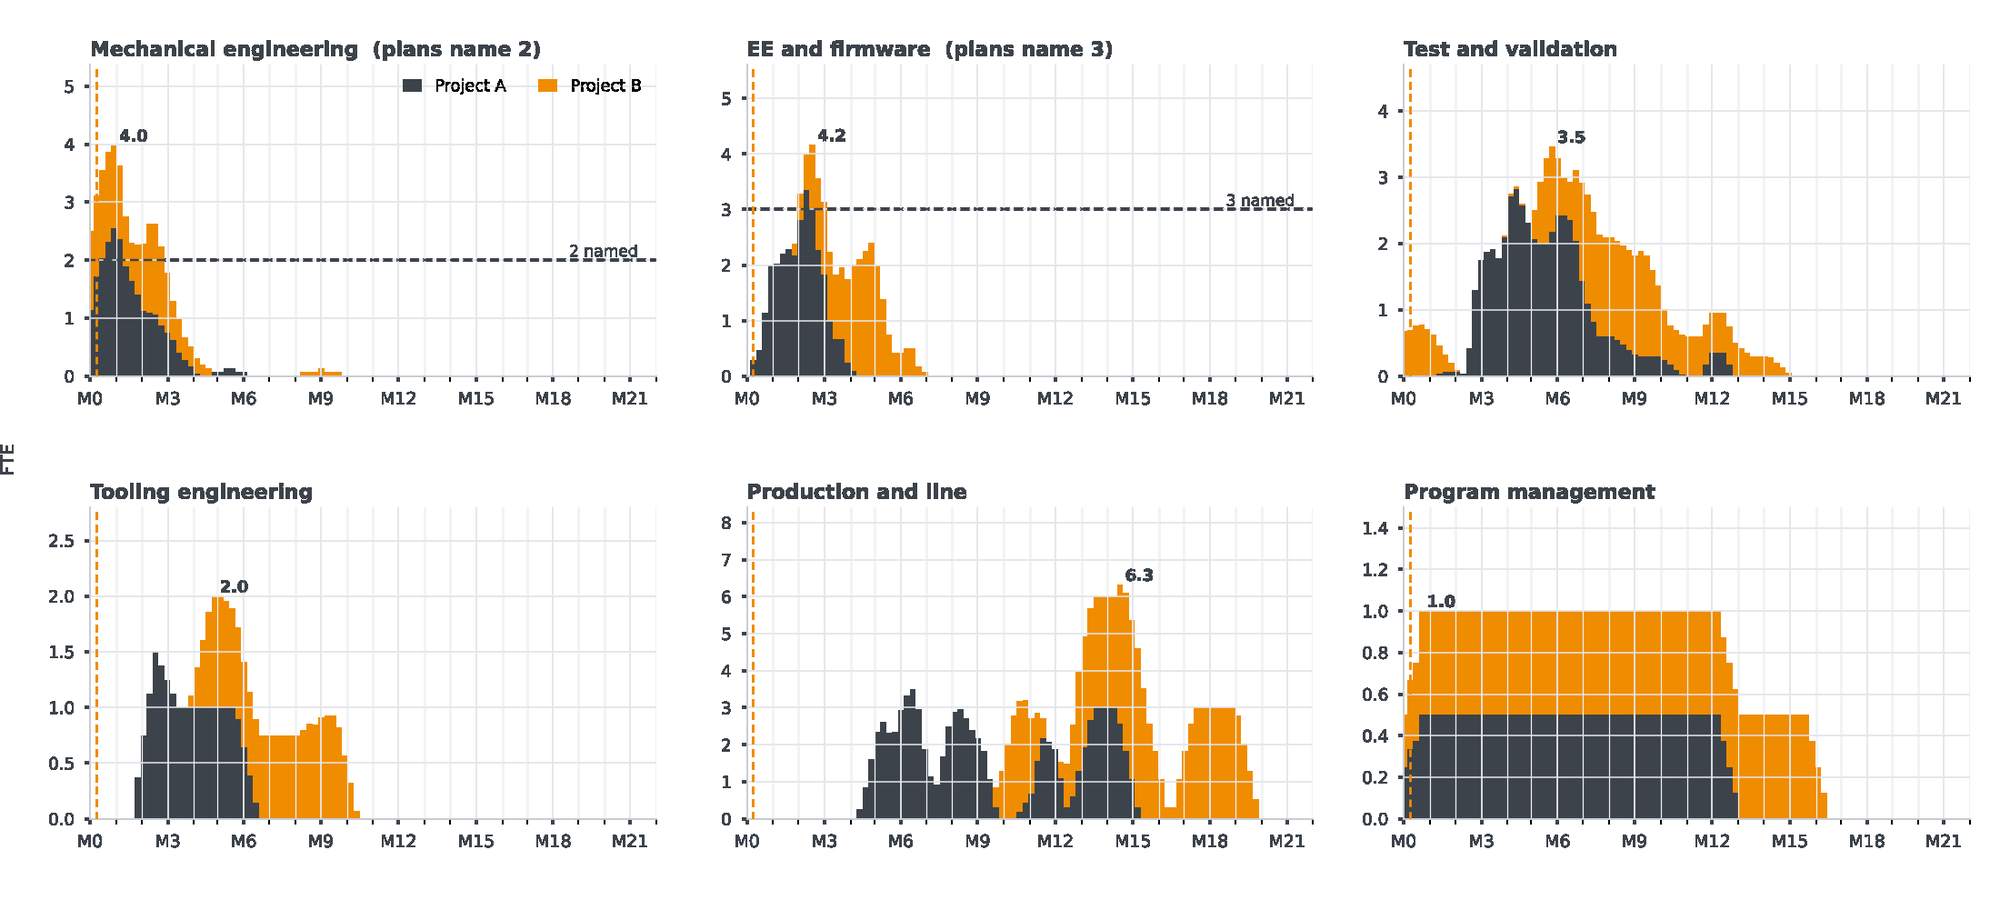
Split by resource type, the collision becomes legible discipline by discipline. The dashed line in each panel is the number of engineers the plans actually name. Where the bars cross the line, the plans are writing checks the roster cannot cash, and the dates in at least one file are already wrong.
The histogram is the evidence. The questions are the meeting.
A resource histogram does not fix anything. So the second artifact is a question set for the next ODM review: sixteen questions in five groups, each tied to a specific finding in the brief, each framed so the answer can be written straight back into the schedules as named resources, dates and quantities. The style is deliberately concrete. Asked whether the handheld's dates move if the sensor family takes priority, a good answer gives specific task dates for both boards, because a 70/30 allocation is a hope, not a plan. Asked whether a fourth engineer can cover the eight-week overlap, a yes comes with a start date and a no comes with a reason, and silence on cost is itself an answer.
The cheapest fix on the list is question fifteen: will the ODM provide named resources and a status date in each weekly schedule update, so the loading can be recomputed from the file rather than estimated. And the last question steps back from the two projects entirely and asks for the ODM's own view of its capacity for the program as a whole. Evasion there is diagnostic of where the relationship sits on the supplier-partnership ladder Liker and Choi described in 2004.
The meeting it sets up
The brief and the questions go to the ODM review together, and the working rhythm after that is simple: map the demand curves against the ODM's stated availability, then refresh the picture monthly from the weekly schedule saves so the partner can adjust as the plans move. One more thing belongs in that conversation, and it is the part most teams skip. Tell the ODM you expect to pull the schedules in. A partner who assumes you will slip does the quiet, rational thing: it reassigns your people to customers who ship on time, and your plan loses its staff before it loses its dates.
The study cost three minutes because everything expensive had already been paid for. The schedules were real, refreshed weekly. The resourcing history was structured in the project folder. The question, can one partner staff two plans at once, went from idea to quantified brief to a sixteen-question agenda inside a coffee break. Both documents are below; swap in your own schedules and the same study runs on any program that shares a factory. The next pass scales the method to the full portfolio: fifteen products, four ODMs, and the acceleration scenario on top.
Related on lateralworks: Targets are top-down; schedules are bottom-up, The exception report, and No Risks, No Schedule.