How often have you ever wanted to know how fast you are getting through work on a program or project? In the software development world you often want to track the rate of completion of features or the rate of completion of bugs. In the semiconductor industry when building a new fab, it may be the rate of completion of tools.
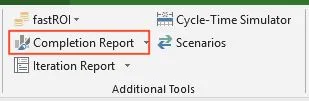
It is possible to use the “Completion Report” function in fastProjectAI to track the rate of completion of work and is found in the Additional Tools group.
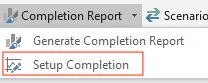
The first step is to setup the completion report.
This consists of:
Identify the number of different groups to track and give the them names, e.g. high priority features, low priority features or Release 1 features, Release 2 features, etc. There is no limit to the number of groups.
Assign the name to the relevant task in the schedule you want to track
Assign the name to the Target date you want to have them completed by (each group must have a Target date)
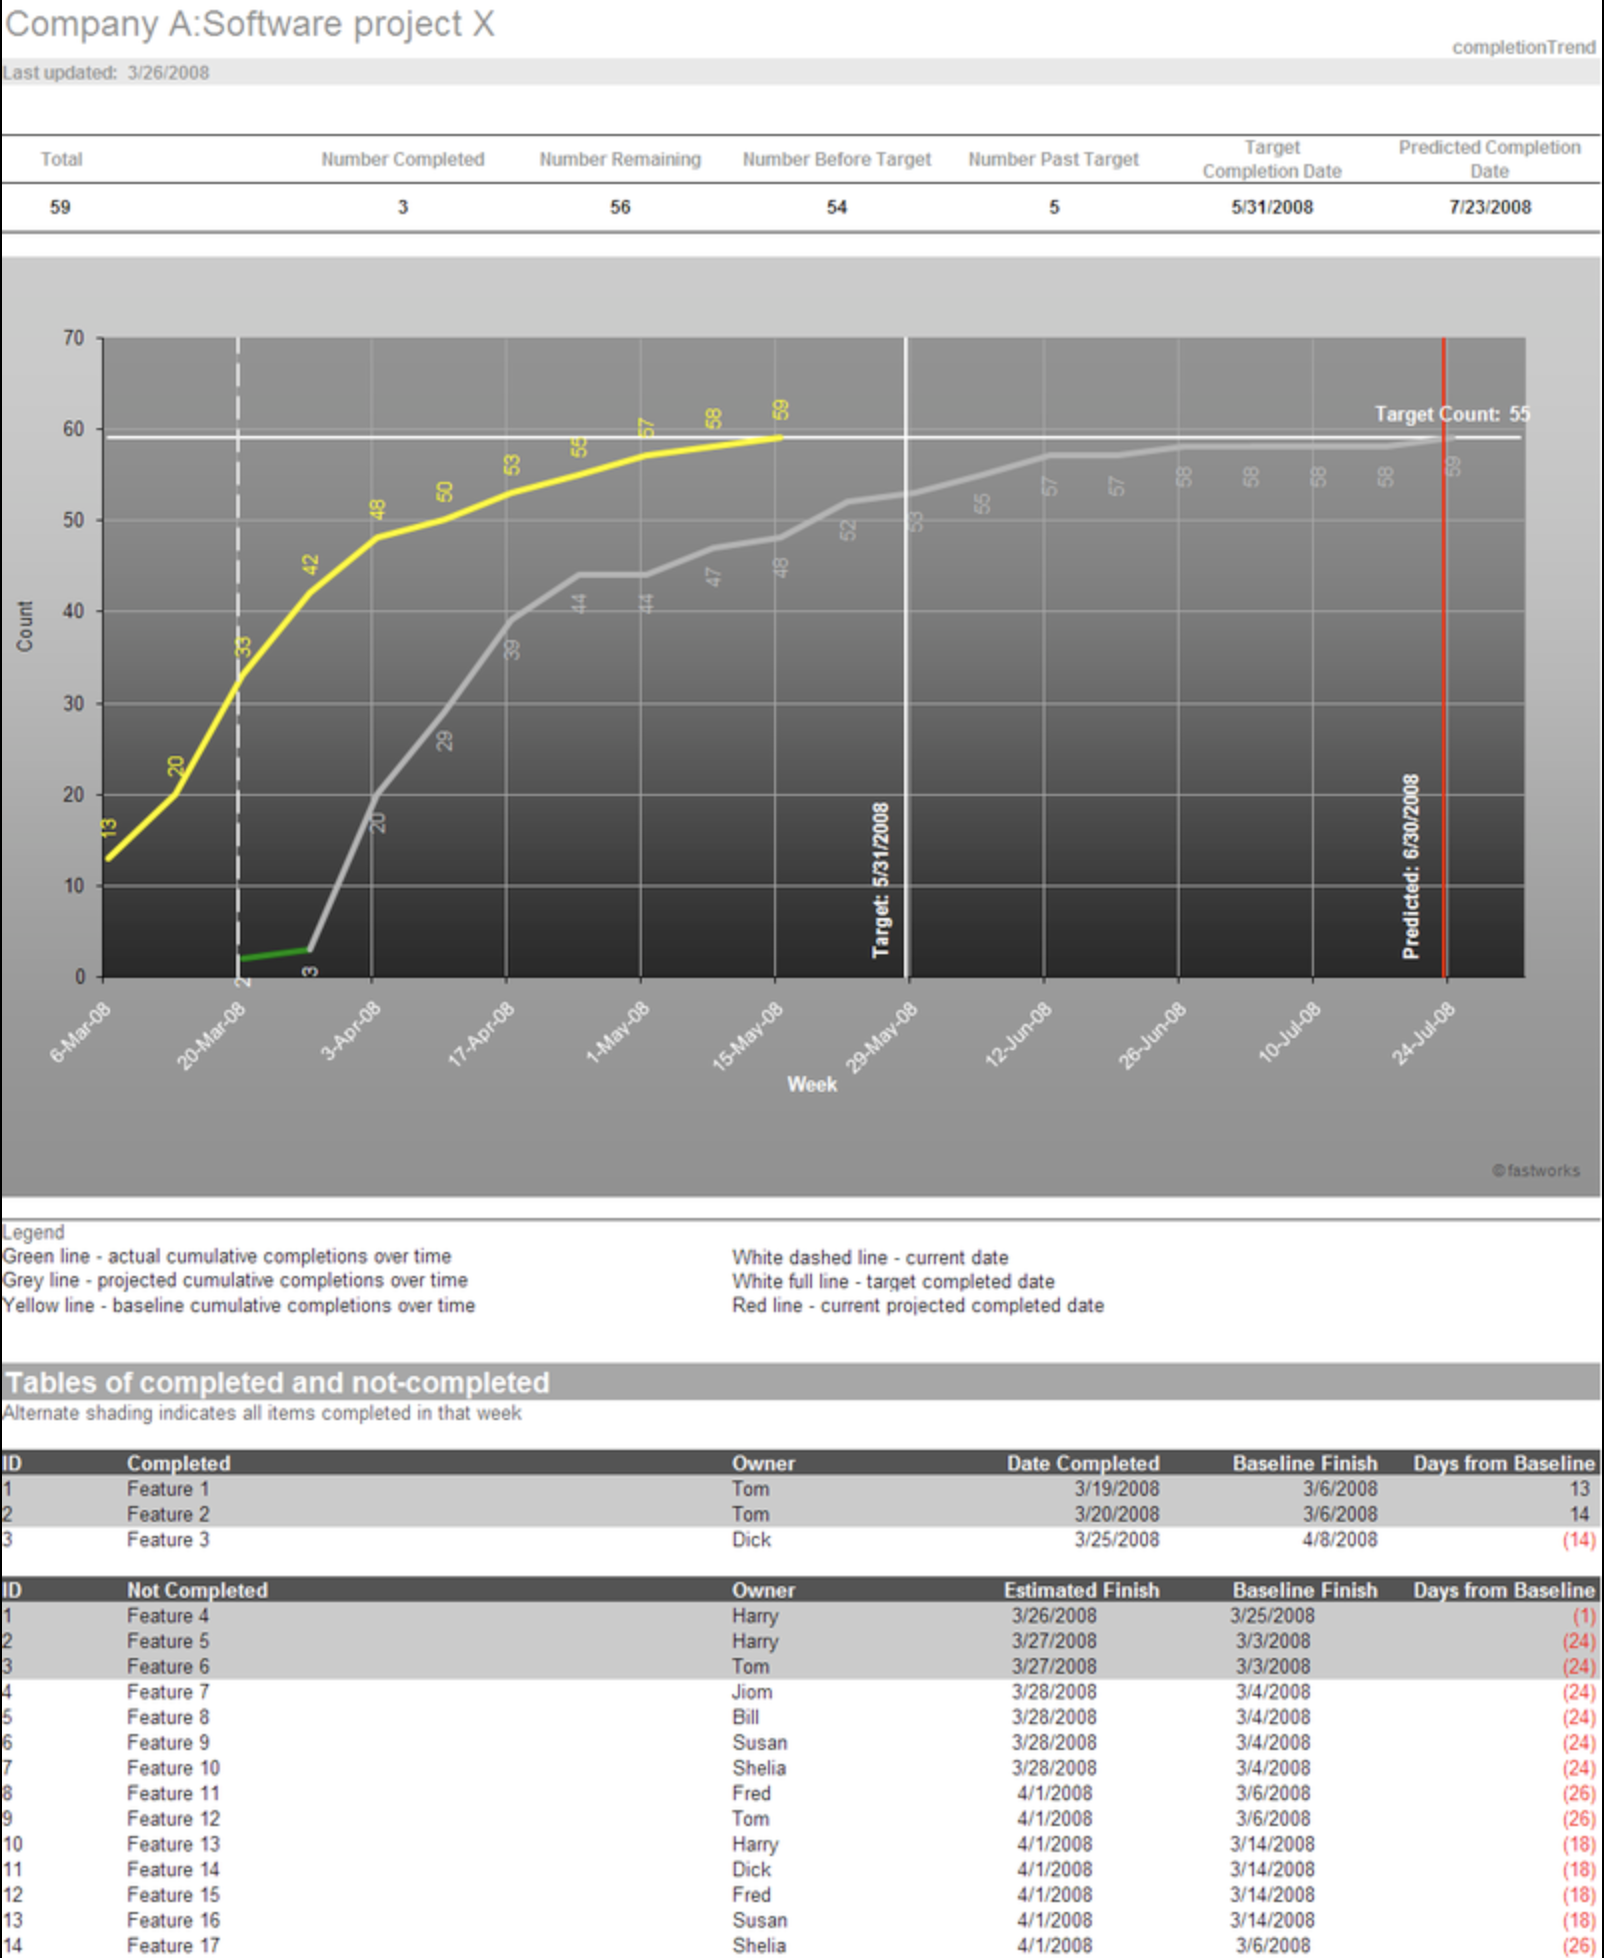
To get a completion trend report, simply click on Generate Report in the Completion Report button. The image below provides an example of the output. One chart is created for each group tracked. The yellow line represents the baseline rate of completion, the gray line represents the rate of completion based on the current schedule and the green line represents "actual" completion to date. Three vertical lines represent the current date, the target date and the estimated completion date.
As an added benefit, the table below the chart provides a list of when the item was (or estimated to be) completed.