Aggregate, then drill down by exception. One problem when assessing a multi-project portfolio is knowing where to focus. In some cases there can be hundreds of projects in various stages of completion.
The trick is to focus on the exceptions; those projects that have the greatest gap between their expected completion date and the committed target date. In addition, we want to see those late projects who’s gap is potentially too great to close. These are the projects that are really in trouble and need help. This is where to focus finite resources if TTM is critical.
Some of the questions a leadership team might ask include:
Is the milestone getting worse or is it trending in the right direction(i.e., back to the target date)?
Answer can be found in the trends of the individual wigglecharts for each project.
What is driving the milestone date (i.e., causing it to push out)?
Answer can be found in the individual project schedules. Ask for a critical path to the milestone in question. This is the path that is pushing out the milestone.
What can we do to help you close the gap?
Answer can be found by asking the program team what they need in order to compress the critical path in terms of decisions, information, tools, materials, people, change in work flow, etc. You can also challenge the way the work is being done in order to find ways to optimize the workflow. All these possibilities need to be explored in order to find ways of closing the schedule gap.
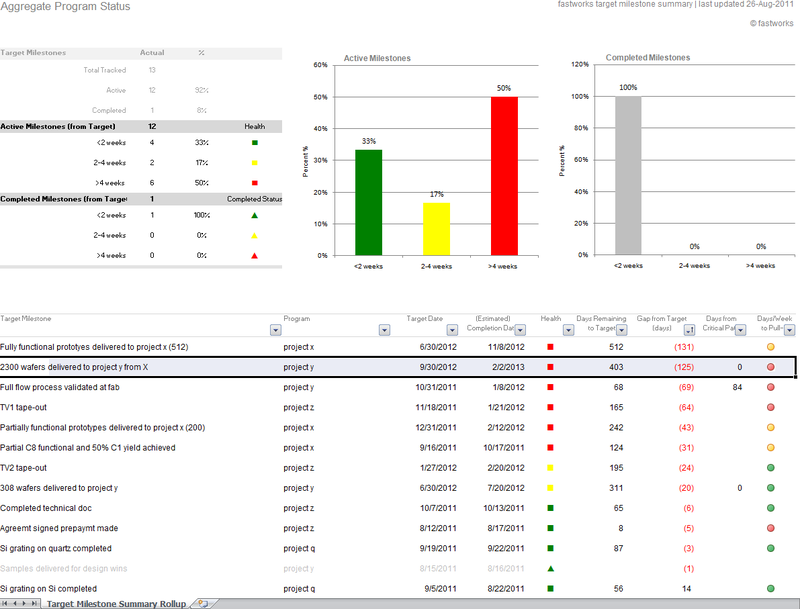
The following is a sanitized example of such an aggregation of projects and then a drill-down into one of them. The one that is the “exception.” They were aggregated automatically by rolling-up each project’s wigglechart, then filtering on the project that was the latest and most at risk (i.e., needing to be pulled-in by more than 2 days/week in order to hit target).
In this example, Project Y’s target milestone called “2300 wafers delivered to Project y from X” and it is 403 days away from the target date, it is predicted to be 125 days late, it is on the critical path, and it needs >2 days/week to be pulled in (see red circle to the right). Clearly this is >4 weeks late. This is one of the “exceptions” to focus on, since you can’t focus on everything all the time.
Next we drill down to view the wigglechart trend for this milestone. The trend is good, but they have a large gap to close. Given that this is a bleeding edge research project, the team knows that the schedule could change if they achieve the expected breakthrough they all anticipate once the experiment results have been analyzed. The real question is, “What is driving the critical path to this milestone… what is pushing it past the target date?”
This is the critical path to the target milestone. Notice that one of the main drivers is not a technical breakthrough, but rather a “procurement task.” This is the long pole that needs to be cut down to close the gap.
This is an example of aggregating trend information and then drilling down, by exception, to find out how to help a project team close the gap. Imagine this kind of information on hundreds of projects in a development portfolio, automatically generated by the weekly Refresh Planning process, running at the team level.