Wafer-sort bring-up on the first silicon of a bleeding-edge semiconductor product, the kind of program where nothing is standard and everything is hard. Sort-flow validation slipped five weeks in nine days, and the MVP release to the lead customer sits nine weeks behind target. Everyone on the program knew it was late. What the escalation meeting needed was one picture that says why, with evidence behind every entry. We built that picture with a tool from the 1960s and an evidence base no conference room could hold.
The tool is the cause-and-effect diagram Kaoru Ishikawa popularized in the 1960s, one of the seven basic quality tools, named for the fish skeleton it resembles. The classic way to build one is a brainstorm: a conference room and whatever the people in it remember and are willing to say out loud. That last clause is the problem. A workshop fishbone holds opinions, sorted into categories, filtered through what people will say in front of each other.
This one was built from the record instead. Claude read twelve months of the program’s own words: email, Slack and WhatsApp correspondence, the project document database, transcripts of the weekly refresh planning meetings with the core team, and the test-readiness and risk memos. It also read the schedule itself, extracted from the Microsoft Project files: tasks, notes, eleven saved baselines, and an independent recompute of the critical path. The AI’s job here is the one we always give it, synthesis; the decisions stayed with the core team. The analysis was then refined into a reusable Claude Skill; the initial analysis and its refinement together took less than ten minutes on the Fable 5 High model. Every entry on every bone traces to a dated document, and the quotes are verbatim.
What the record says that the room would not
The analysis sorted the causes onto eight bones: design complexity, probe card delay, tester access, skills and expertise, documentation, language, culture and time zone, people load, and process, governance and data. Wafer sort, for readers outside semiconductors, is the first electrical test of each die on the wafer; bring it up late and finished silicon sits untested.
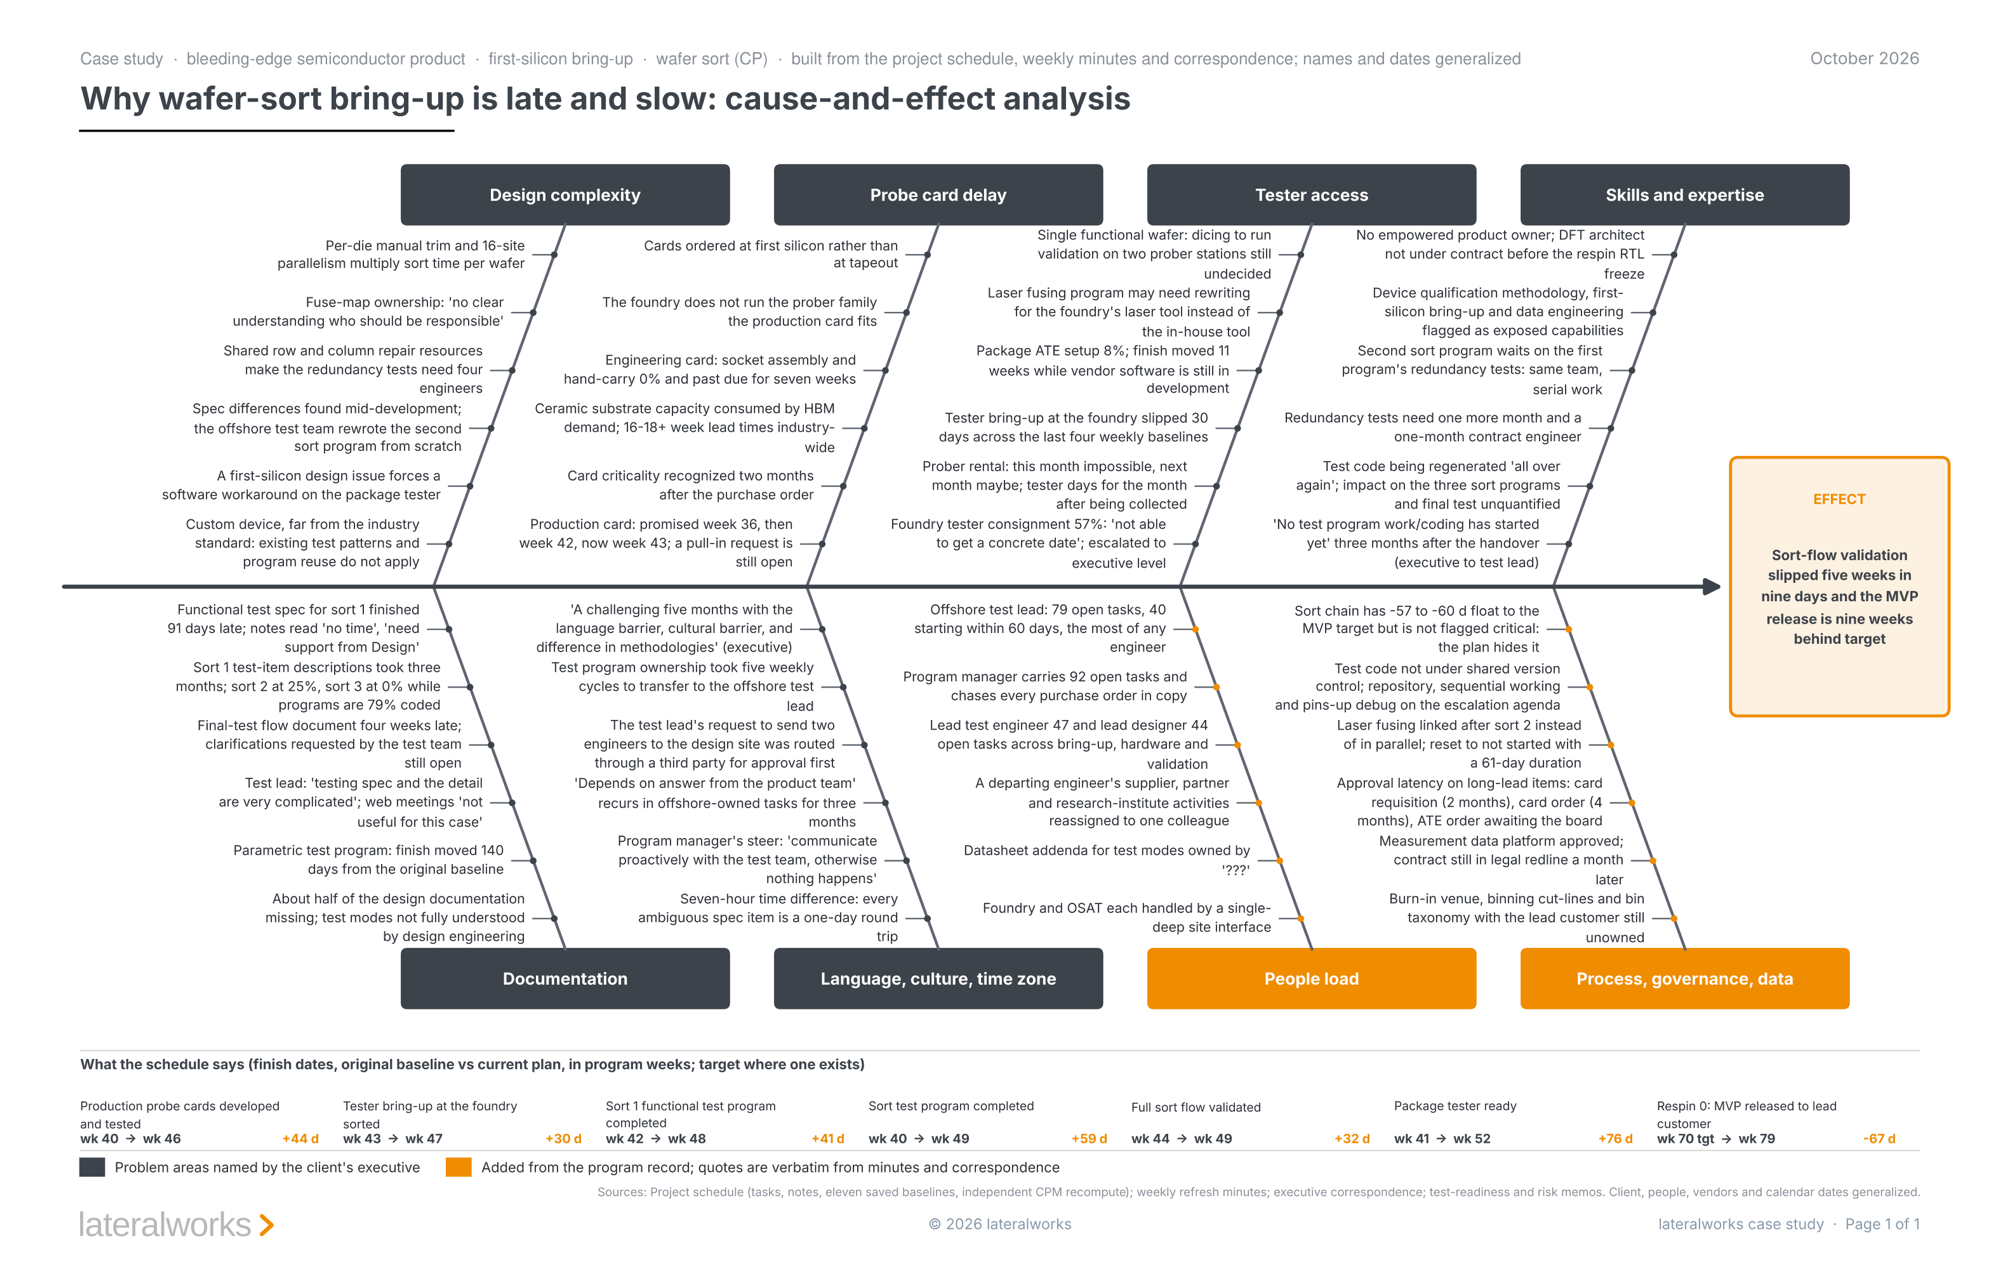
Read the bones and a pattern appears that no workshop would have produced, because the most damning entries are the ones a room politely avoids. Fuse-map ownership: "no clear understanding who should be responsible." The foundry tester consignment at 57 percent and "not able to get a concrete date," escalated to executive level. Production probe cards ordered at first silicon rather than at tapeout, with their criticality recognized two months after the purchase order. Approval latency on long-lead items: two months for the card requisition, four months for the card order. And three months after the handover, from the executive to the test lead: "No test program work/coding has started yet."
None of this is anyone’s opinion. It is the program’s own record, placed on the bone where it belongs. A workshop can be lobbied. A retrieval cannot.
The schedule is a bone too
A fishbone without dates is a complaint list. This one has the schedule underneath it. Seven milestones tell the story, original baseline against current plan:
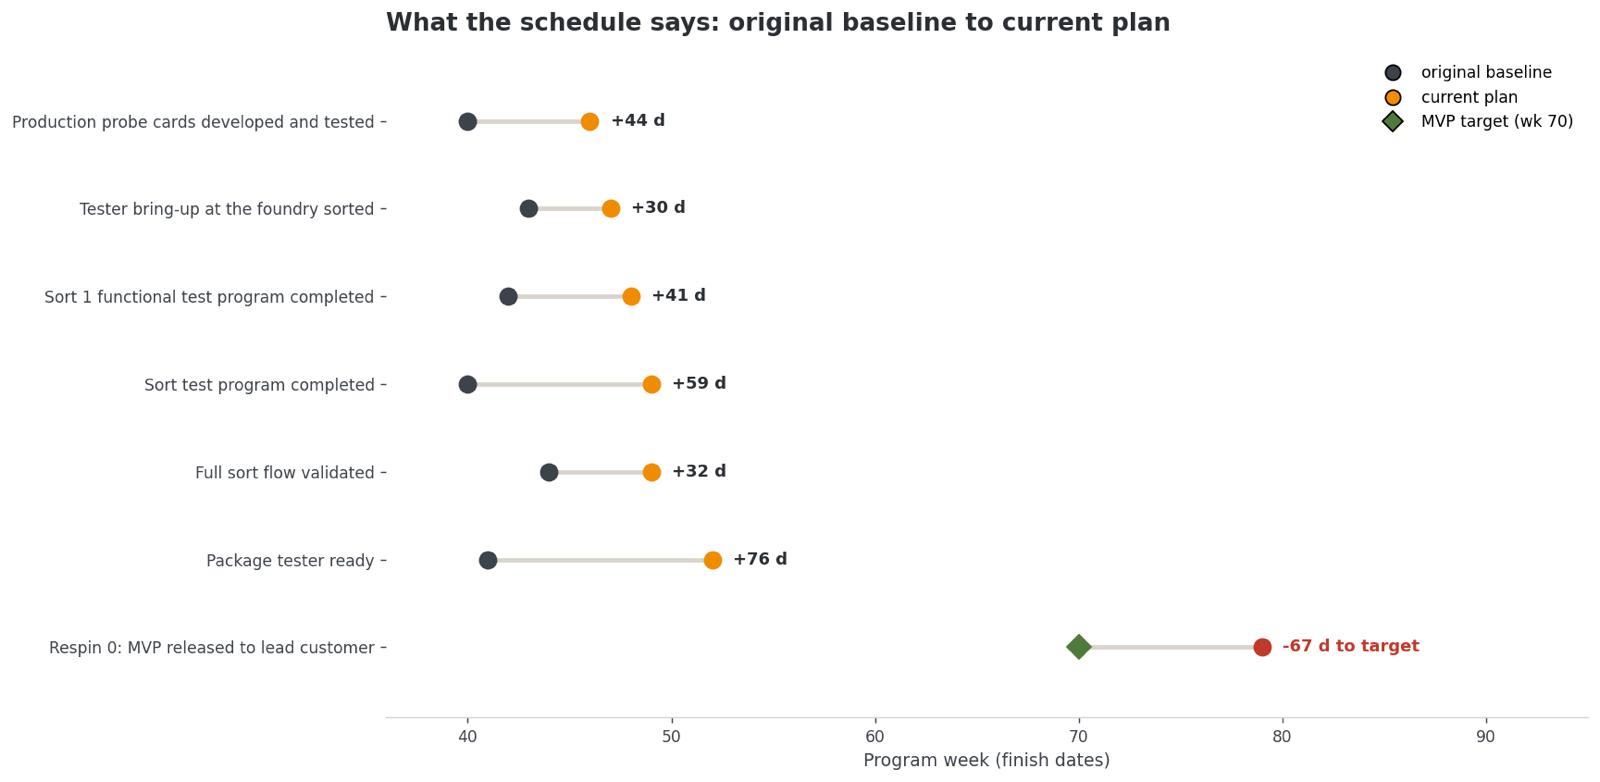
The probe cards moved 44 days, the package tester 76, the sort test program 59. And the number that explains the escalation: the sort chain runs at minus 57 to minus 60 days of float against the MVP target, yet it is not flagged critical in the plan. The plan hides it. The tester bring-up slipped 30 days across the last four weekly baselines, a trend you can only see because the schedule is refreshed weekly and every baseline is saved. The same files that feed the weekly refresh fed the diagnosis.
From causes to a ranked treatment plan
A diagnosis is worth what the treatment is worth. The second artifact is the corrective action plan, and here the live schedule earns its keep: because the causes are anchored to schedule data, the fixes can be ranked by their effect on the sort-flow validation date rather than by who argues loudest.
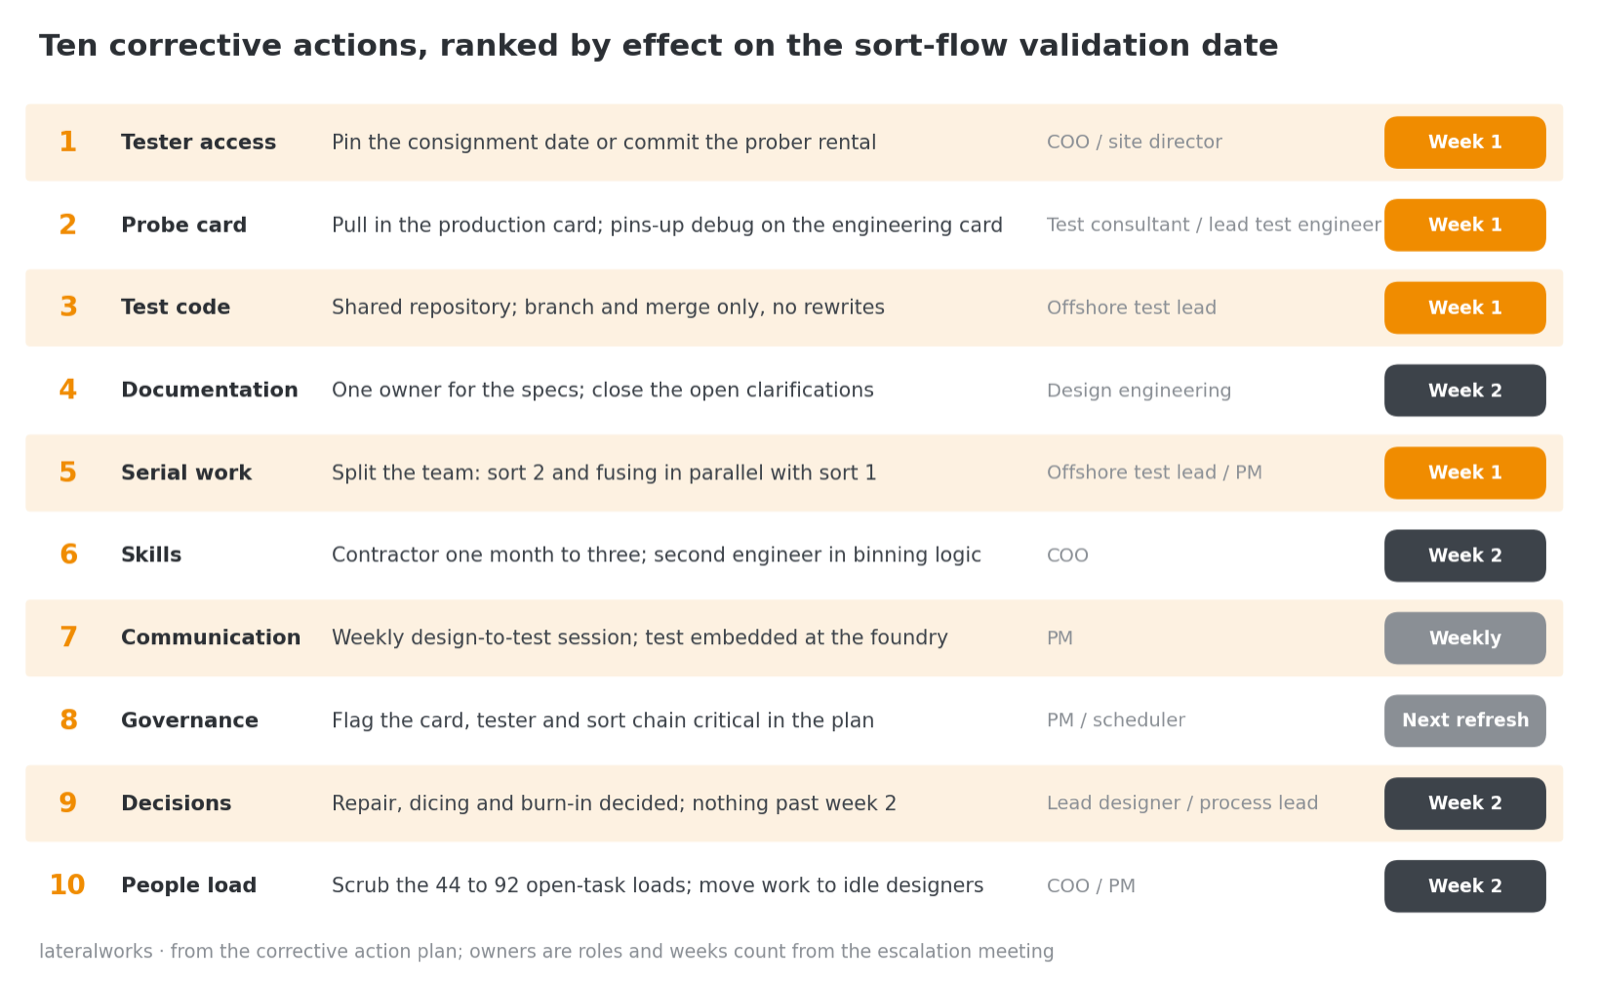
Ten actions, each with an owner and a clock. Four land in week one: pin the foundry tester consignment date or commit to the prober rental; pull in the production card while running pins-up compile and debug on the engineering card, so the code is ready the day the card lands; put all sort and final-test code in a shared repository, branch and merge only, no further rewrites from scratch; and split the test team so sort 2 and the laser fusing program run in parallel with sort 1. The owner column names the COO and the PM, not "the team." The deadlines are week one and week two, not next quarter. No decision carries past week two.
Lessons learned, priced
The same analysis produced eight lessons for the next development project, and each one carries its price from this program. Order long-lead test hardware at tapeout, not at first silicon; this card was ordered at first silicon, recognized as critical two months later, and delivered four months after that while silicon waited. Put a test engineer in the room for every DFT decision; no BIST, manual trim and a first-silicon timing issue were all absorbed by test as workarounds. Recompute float every refresh and flag the real critical chain; this chain ran at minus 57 to minus 60 days without appearing on the plan’s critical path. Readers of the critical path analysis will recognize the first lesson: a long-lead order placed late is the same failure in a different industry, and the fix is the same, move the order upstream and budget the correction as a signed risk.
The tool is old. The evidence is new.
Ishikawa’s diagram has not changed. What changed is what it can hold. A two-hour workshop fishbone holds what the room remembers. This one holds what the program wrote down for a year, anchored to a schedule that knows every date and every baseline. The method travels: the same schedule extraction gave us the cycle time metric and the critical path analysis, and the same transcript mining gave us the seven systemic interrupts. The division of labor does not change: Claude reads everything, the core team decides. Diagnosis from the record, treatment on a two-week clock.
References: the Ishikawa diagram entry at Wikipedia and the fishbone guide at ASQ, both linked above. Both program artifacts are attached below; client, people, vendors and calendar dates are generalized.
Related reading: Seven systemic interrupts, How lateralworks uses AI, The cycle time metric, What the critical paths have in common, My Schedule Keeps Slipping..., The Weekly Schedule Refresh, and The FTTM execution system.