In August we published Seven systemic interrupts: seven patterns of delay that repeated across a four-program semiconductor NPI portfolio, found by mining five months of core team meeting transcripts. The programs all target the AI data center segment, where the market does not wait. Ten weeks later we ran the analysis again, on everything the portfolio's meetings recorded between August 15 and October 28. This article is the update: what the new window says causes delay, what moved because the first analysis named it, and what is still open.
The short version. All seven interrupts are still alive, but ten more weeks of evidence consolidates them into five causes, and one cause is new. Four of the five largest slips in the window trace to a supplier or a cross-program dependency. And every recovery in the record, including a 298-day one, came the same way: not from working faster, but from removing a dependency.
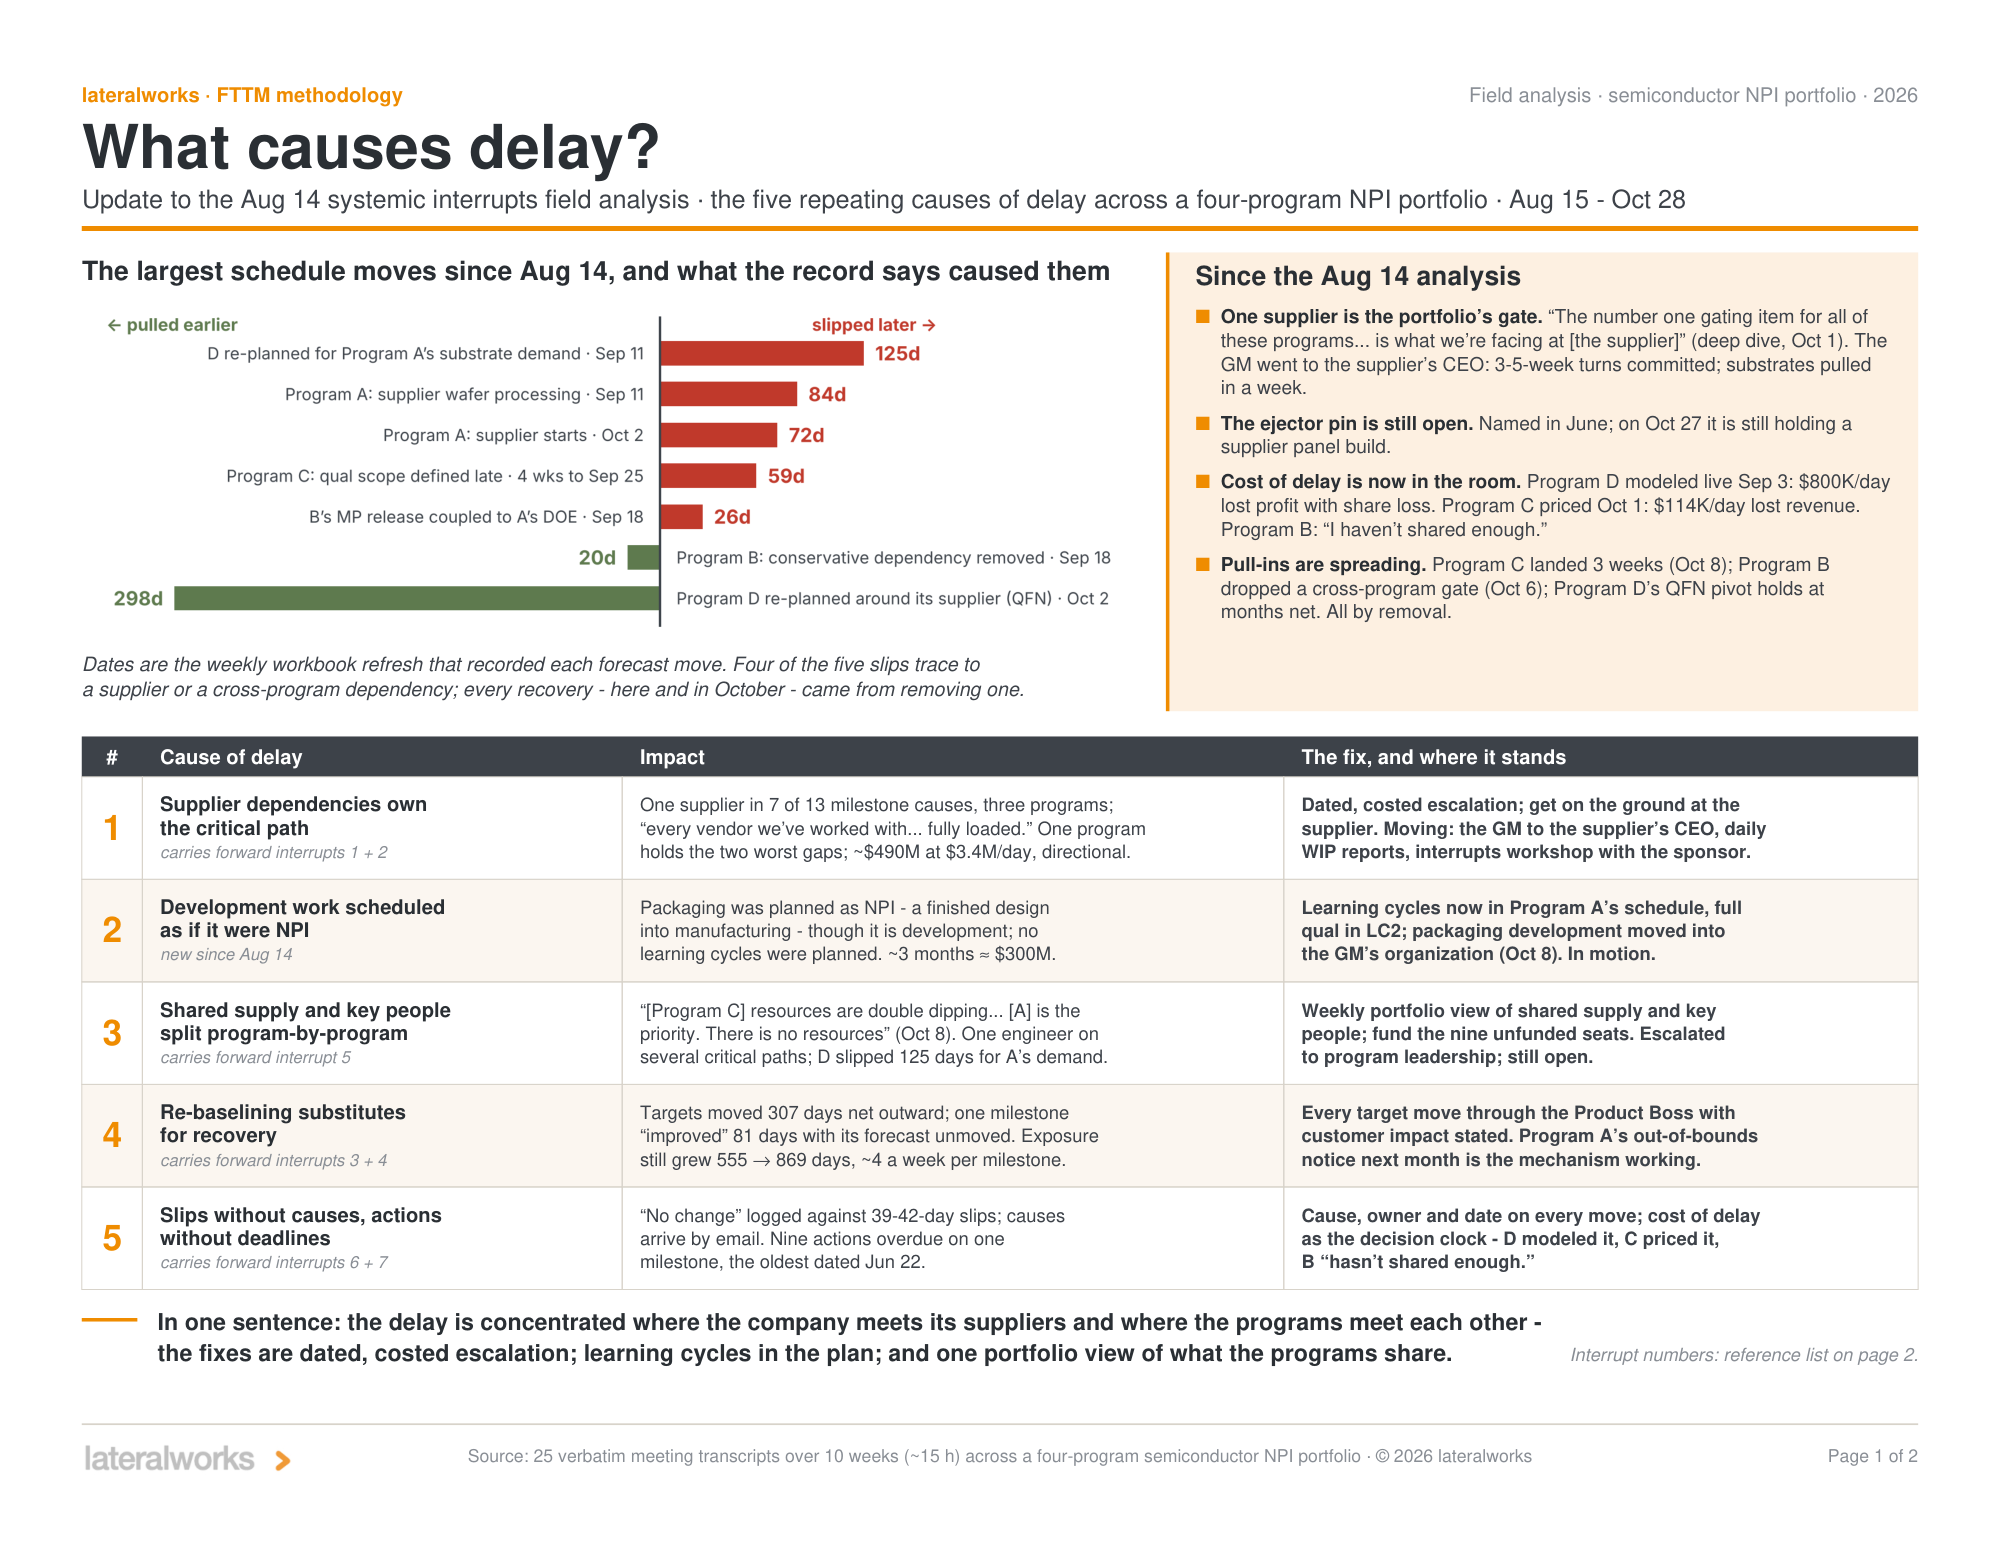
The update, in one page
The field analysis is one page plus a reference page, and it is built to be argued with: every cause carries its impact in the record's own words and numbers, and the fix with its current status. The largest moves since August 14 sit at the top. On the slip side, a 125-day re-plan when one program's demand displaced another's, supplier processing and start dates moving 84 and 72 days, a qualification scope defined four weeks late. On the recovery side, a 20-day pull-in from dropping a conservative dependency, and a 298-day recovery from re-planning a program around its supplier. Dependencies put the days in; removing dependencies took the days out.
The whole update in one sentence
The delay is concentrated where the company meets its suppliers and where the programs meet each other. The fixes are dated, costed escalation; learning cycles in the plan; and one portfolio view of what the programs share.
Seven interrupts, five causes
The August analysis named seven interrupts. The October evidence rolls them into five causes, and the mapping is worth a minute because it shows the system clarifying itself. The two supplier interrupts, the unowned tooling item and the escalation that stalls at the company boundary, merge into one cause: supplier dependencies own the critical path. One supplier appears in seven of thirteen milestone causes across three programs. The two behavior interrupts, the pull-in mindset living in one program and the facilitation gap, merge into the re-baselining cause: when recovery is hard, teams move the target instead, 307 days of net target movement in ten weeks, while real exposure grew from 555 to 869 days. The record interrupts, administrative latency and silent moves, merge into the fifth cause: slips with no causes attached and actions with no deadlines, "no change" logged against 39-to-42-day slips.
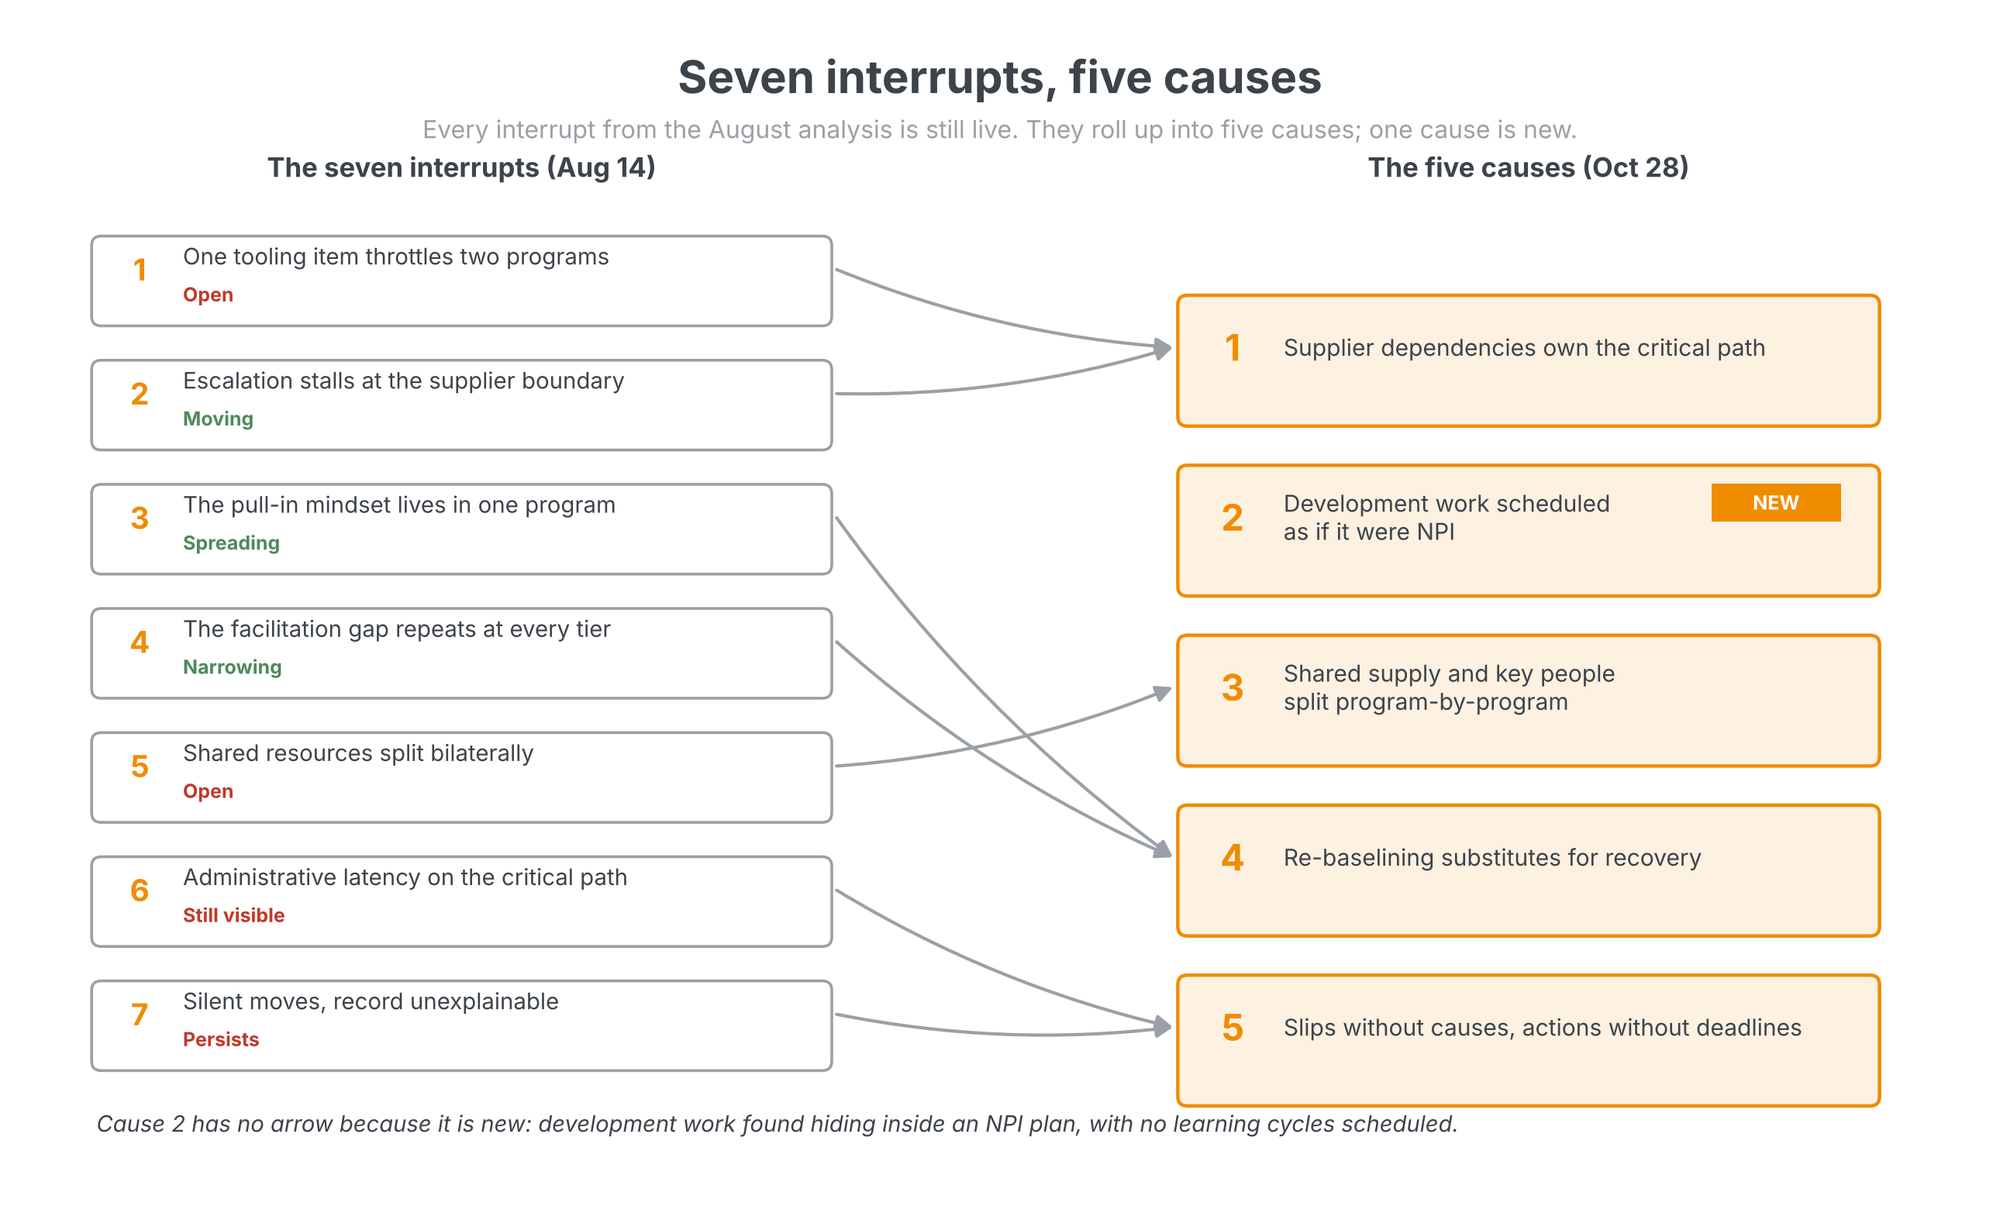
The new cause is the quiet one. Development work had been scheduled as if it were NPI: packaging that was still being invented was planned like a finished design heading into manufacturing, with no learning cycles in the schedule. The gap is worth roughly three months, about $300M at the program's own rates. The fix is already moving: learning cycles are now in the schedule, with full qualification in the second cycle, and packaging development moved into the GM's own organization. Misclassifying development as NPI is one of the oldest failure modes we know, and it hid inside this portfolio for months because each program looked normal from the inside. Only the cross-program view caught it.
A side note on the word interrupt. It is not only a computing metaphor. At the individual level, the research is decades old: interrupted workers compensate by working faster and pay for it in stress, frustration and time pressure (Mark, Gudith and Klocke measured it). Organizations do the same thing. A program that keeps absorbing cross-program interrupts looks busy and committed while its written record quietly fills with unexplained slips. The compensation is invisible; the bill is not.
The method, now monthly
The dataset behind this update is the same instrument we built in August, running longer. Otter.ai has now recorded eight months of the portfolio's refresh and pull-in meetings, nearly 100 hours of transcripts across the four programs. Claude reads that database through a connector, and the analysis itself is packaged as a skill: it scrubs the window's transcripts, compiles the delay patterns against the prior run, and produces the field analysis. This update covered 25 transcripts, about 15 hours of meetings, and the compilation took under five minutes. Nobody re-listened to anything.
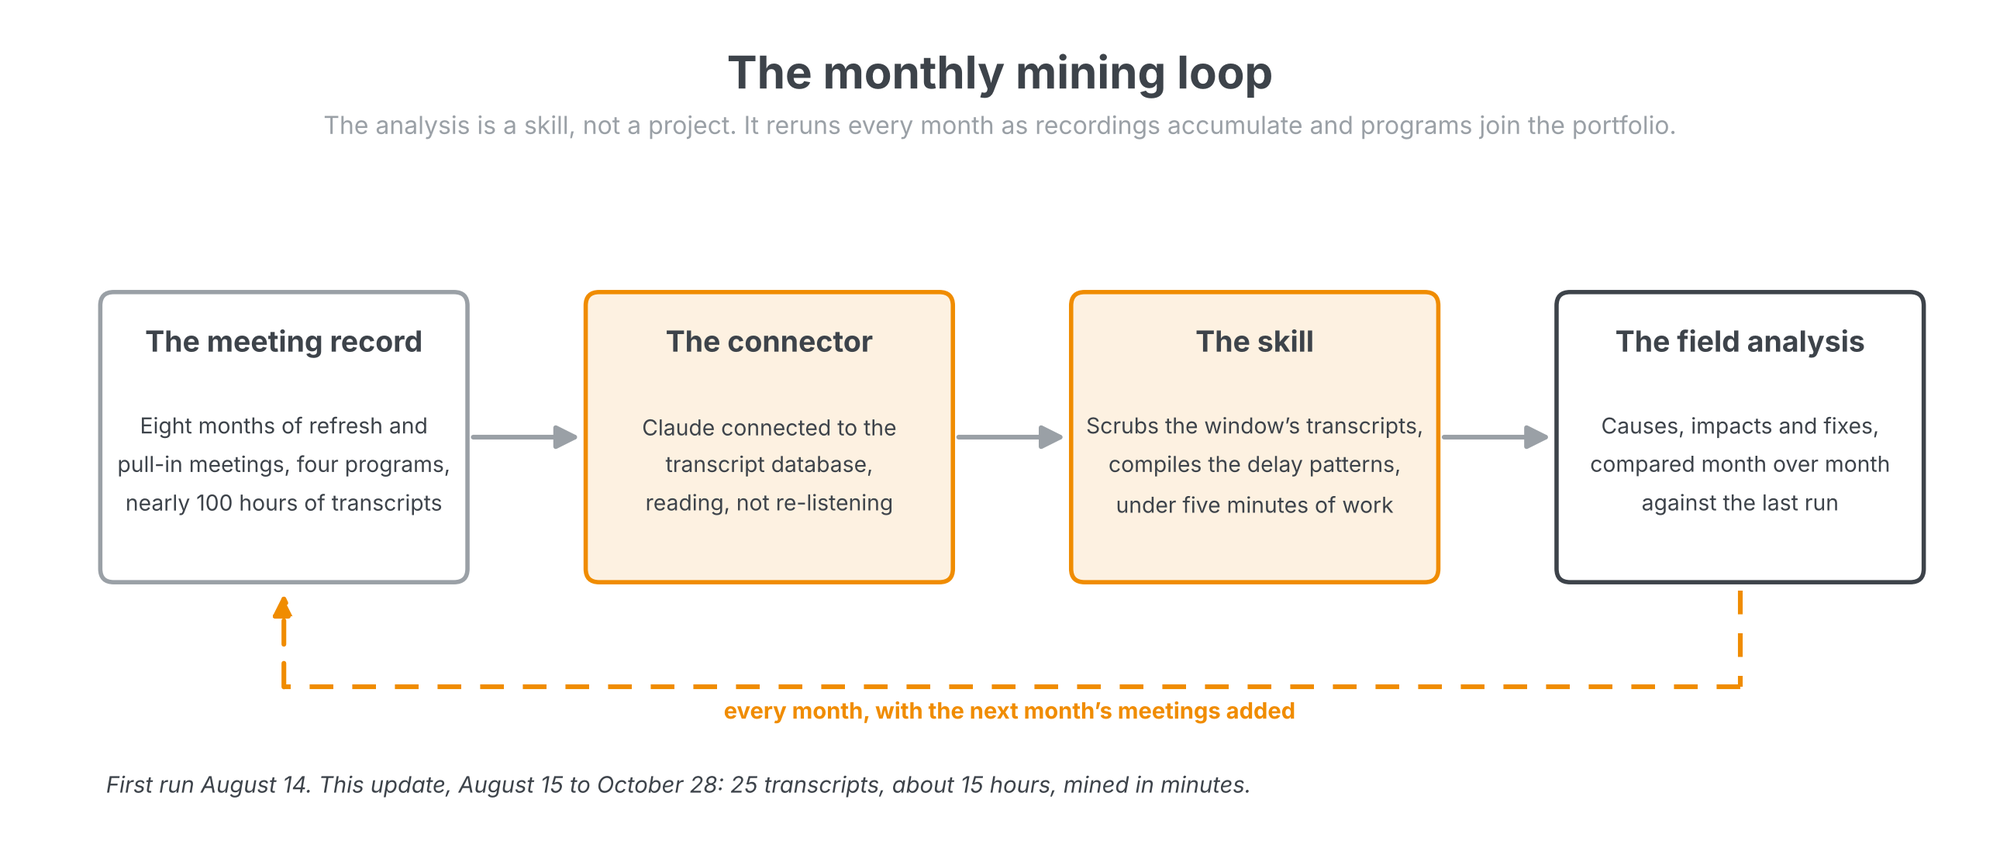
The skill is the difference between a snapshot and a trend. The August analysis was a finding; this one is a measurement against it, interrupt by interrupt: which fixes moved, which stalled, what is new. From here it runs monthly, and as programs are added to the portfolio they join the same analysis, so the delay patterns of a new program can be compared against the portfolio's on day one. We wrote about the broader toolset in How lateralworks uses AI, and about the same mining applied to a single program's crisis in A fishbone built from the record.
Cost of delay is now in the room
The most important behavioral change in the window is that the cost of delay stopped living in a spreadsheet. In August, the portfolio had a cost-of-delay model and the meetings never cited it. In this window it was used live, three times, three ways.
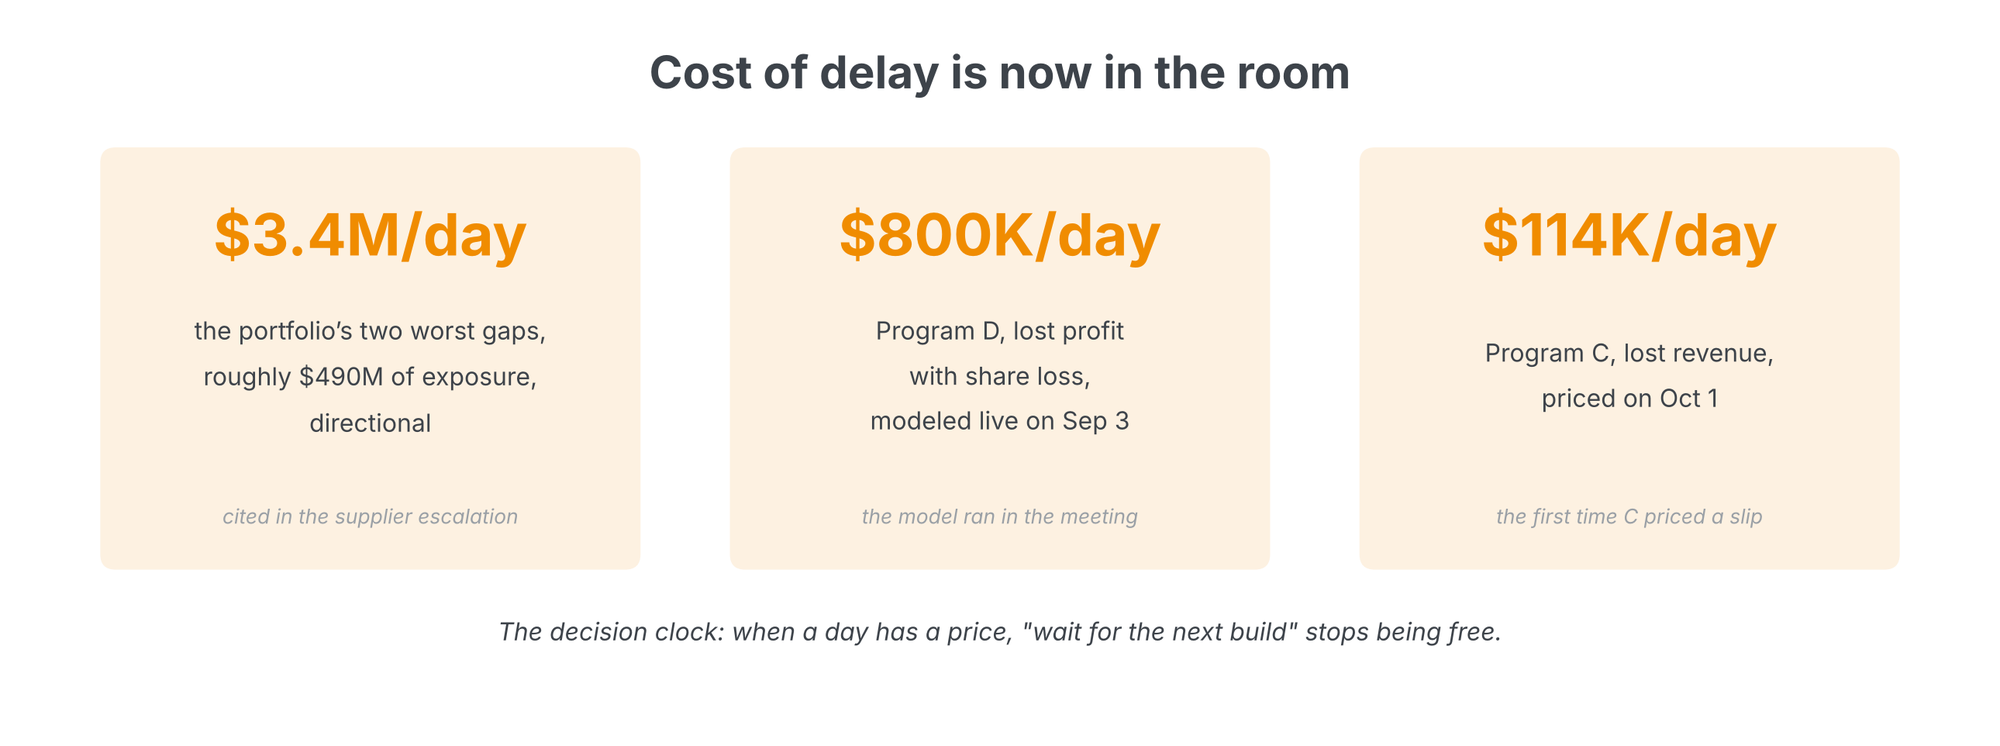
The numbers matter less than where they were said. The $3.4M-per-day figure was cited inside the supplier escalation, which is exactly where it buys speed; the host interrupt taught us that the only way to move an organization that is measured on control is to give it warning and show it the impact. Program D's $800K-per-day model ran live in the meeting on September 3, while the decision it informed was still open. Program C priced a slip for the first time on October 1. The segment explains the stakes: AI-related chips are expected to account for roughly half of global semiconductor sales in 2026, approaching $500 billion in a market growing at 26 percent (Deloitte's 2026 outlook). In a market moving that fast, the cost of a day is never zero, and a cost-of-delay model that nobody cites is just another unexplained slip waiting to happen.
What moved
The point of naming interrupts is that single fixes accelerate the whole portfolio, so the honest test of the August analysis is what moved in ten weeks. The supplier boundary moved most. The GM took the gating item to the supplier's CEO; the supplier committed to 3-to-5-week turns, pulled substrates in by a week, and daily WIP reports now cross the boundary that escalations used to die at. The pull-in mindset spread: the program that recorded slips diligently but never proposed a pull-in landed a three-week pull-in on October 8, and another program dropped a cross-program sample gate two days earlier. The weekly refreshes were renamed "Refresh and Pull-in," which sounds cosmetic and is not; meetings do what their names say. And one program is filing a formal out-of-bounds notice next month, which is the re-baselining fix working as designed: a target move that has to state its customer impact in front of the host organization is a decision, not a drift.
What is still open
The honesty cuts both ways. The ejector pin, a single tooling item first named in June, was still holding a supplier panel build on October 27. Shared supply and key people are still split program-by-program: "resources are double dipping... there is no resources," said one October meeting, with one engineer sitting on several critical paths and a 125-day slip already paid for it. Nine seats remain unfunded. And the record still cannot fully explain itself: causes still arrive by email instead of in the workbook, and nine actions sit overdue on a single milestone, the oldest dated June 22. These are next month's measurement.
That is the real argument for the monthly cadence. None of these findings required anyone to remember anything. The meetings were already telling us; the transcripts hold what the slide decks smooth over. The skill just reads the record every month and keeps score, and the score is what turns seven observations into five causes, and five causes into fixes with dates on them.
Related on lateralworks: The weekly schedule refresh and The portfolio trends dashboard.