For three years on one program, I generated the same report every week. It went out after the weekly schedule refresh, took about an hour to produce from preset views, and walked the reader from the wide program picture down into the status of each workstream. Hundreds of people around the world were on the distribution. In truth, hardly anyone read it. And here is the strange part: the one week I skipped it, just to see what would happen, everybody complained. The report was not being read so much as relied on. People reached for it when they had to carry status upward, and its real job was orientation: it told them where everything stood inside a picture they already recognized.
That paradox took me years to name, and a recent working session with a client brought it back in sharp relief. The team had replaced static reports with something better, an interactive schedule everyone actually opens, and the leadership was still confused about where the program stood. The missing piece was not more data and not better formatting. It was the difference between two kinds of reporting that usually get collapsed into one: status reporting and context reporting.
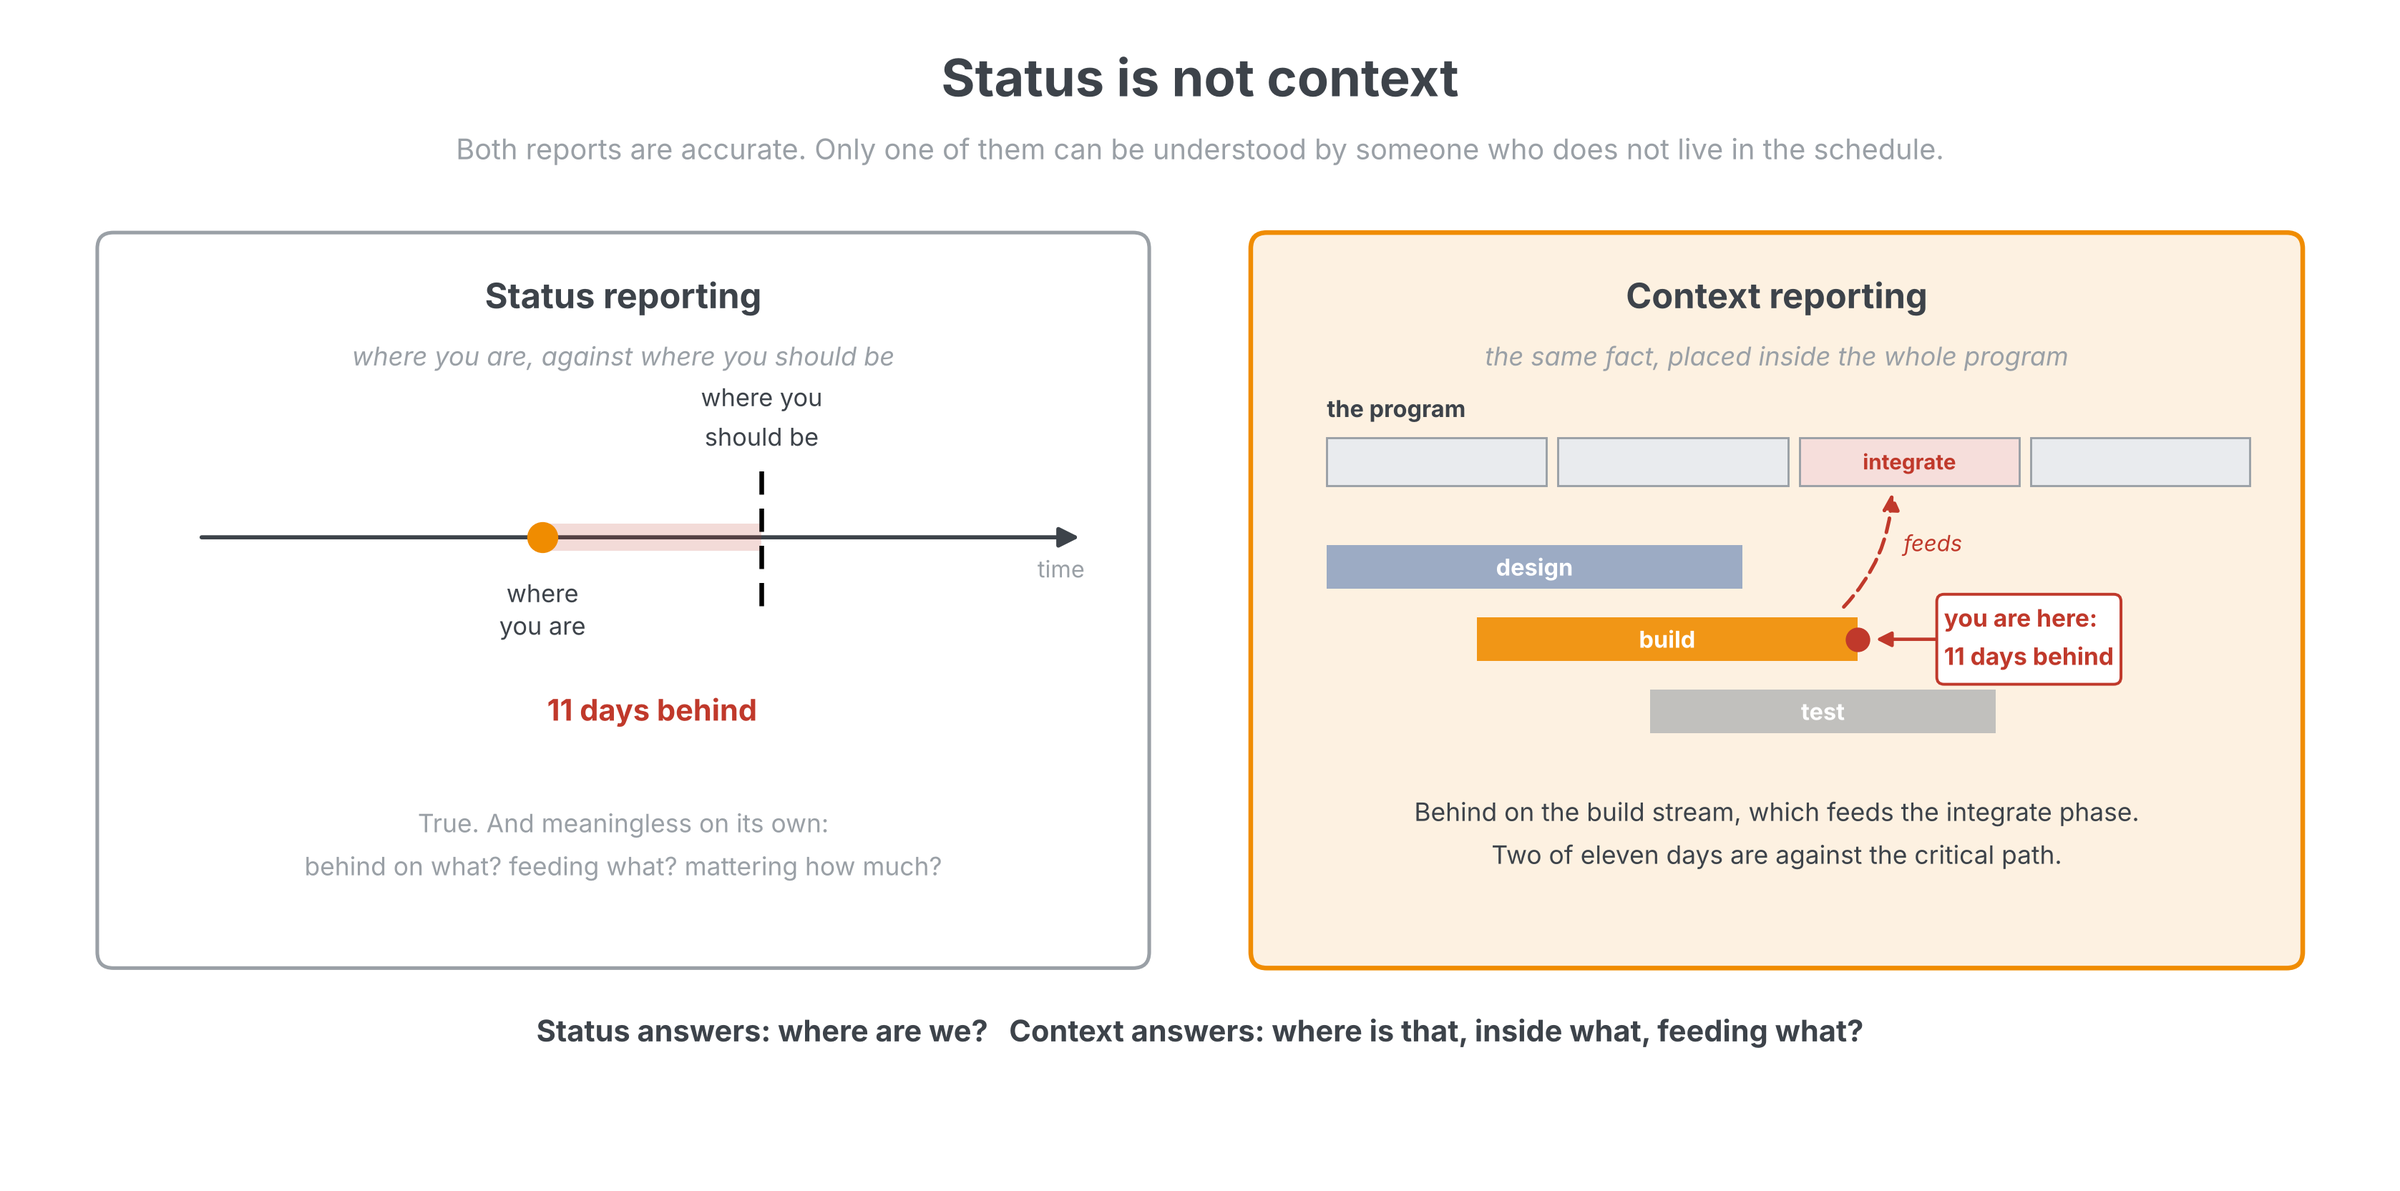
Status is not context
Status reporting tells you where you are in time against where you should be at that time. Ahead, behind, by how much. It is accurate, it is necessary, and on its own it is nearly useless to most of its audience. Context reporting gives the viewer the framework to understand the status. It starts top down, so every detail connects visibly back to the larger picture it belongs to. You need the context before you deep dive into details; without it, readers drown in particulars, and most of them are lost in exactly that way, unable to see the forest for the trees. The effect is not a preference; it is measurable. In a classic 1972 experiment, Bransford and Johnson read people a deliberately vague passage. Those given the context before hearing it understood it and recalled it; those handed the same context afterward did little better than those given none. Context after the fact barely helps. It has to come first.
The reason is a structural asymmetry. The person who builds the schedule works in it every day and knows it intimately: how it is organized, what feeds what, which branch matters this month. That person needs no overview, which is precisely why the reports they produce rarely contain one. Everyone else is second party to the process. They see plenty of activity and none of the frame, and when you have complexity, you need context for the complexity or you cannot understand it at all. Few will say they are lost, because nobody wants to look like the one person who should have known; we wrote about that silence in What they say versus what they mean. The complaints surface later, as "I don't know where anything is," about a program whose every detail was technically available all along.
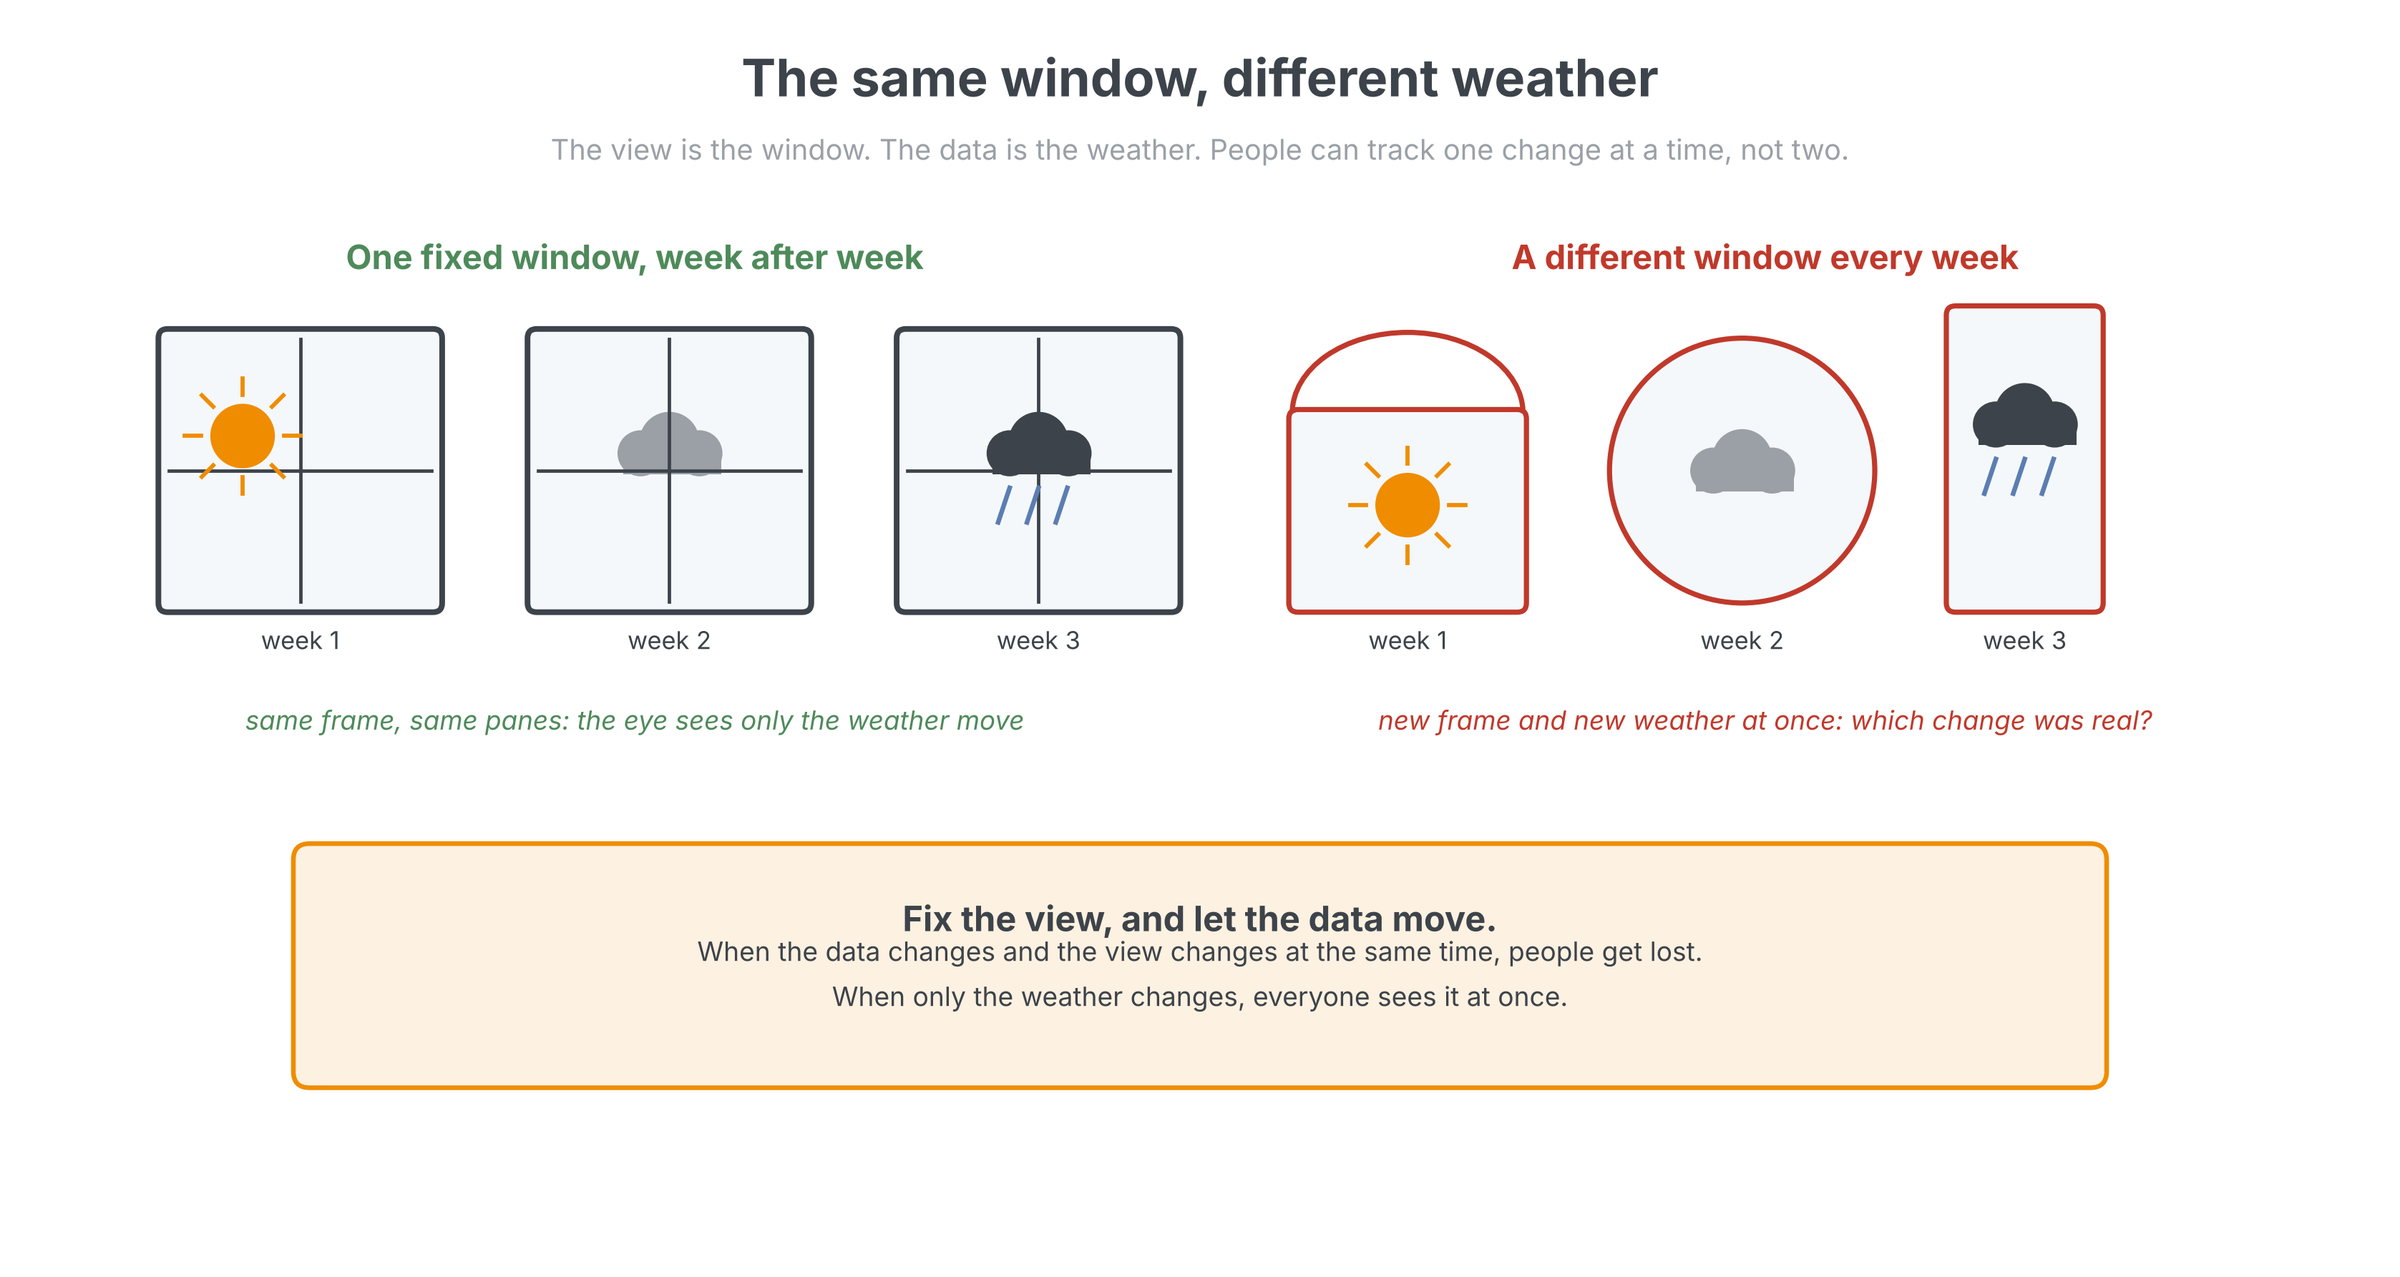
The same window, different weather
Here is the mental model we use with clients. The view is a window. I look out the window, and it is the same window every week; the only thing that changes is the weather. But if I have to run around the house looking out a different window each time, I am seeing different weather through a different frame, and I can no longer tell which change is real. That is what happens to a reader when the data changes and the view changes at the same time: they get lost. Fix the view, and people focus on the change in the weather rather than on decoding what they are looking through.
Designers of statistical graphics have known this for a long time. Edward Tufte's small multiples, the same chart design repeated so that only the data varies, work because a reader learns the frame once and then spends all remaining attention on differences. His test for any display, in Envisioning Information, is the question at the heart of quantitative reasoning: compared to what? A fixed weekly view answers it automatically, because this week always lands on top of the memory of last week.
Fix the window
Build the standard view once and make everyone look through it every week. The structure never changes; only the data does. People stop re-reading the frame and start seeing the weather.
Start at the macro, never at the detail
Context reporting has a direction: top down. The three-year report always opened with the widest view of the program and its trends, then drilled into each workstream, and only then into detail. Start at the macro and drill down; never start with the detail. Detail without a frame is where readers get lost, and it is also where presenters lose their audience in the first two minutes, because the audience is still silently asking what they are looking at while the presenter is already three levels deep. Interface designers converged on the same rule from the other direction: Ben Shneiderman's visual information-seeking mantra, overview first, zoom and filter, then details on demand, has been the backbone of every usable data interface since 1996.
The same rule governs reading as much as reporting. A dense multi-page status report landed on my desk recently, pages of detail on work I do not live in every day, and half of it meant nothing to me on first read. So I did not read it top to bottom. I asked questions of it instead: what are the key issues, what are the potential problems, what are the risks? I had Claude build that framework first, then poured the report through it like a strainer, and what came out the other side was something I could understand and act on. Context first, then detail, is how we approach analysis in general; a report is just another record to interrogate.
One source, many windows
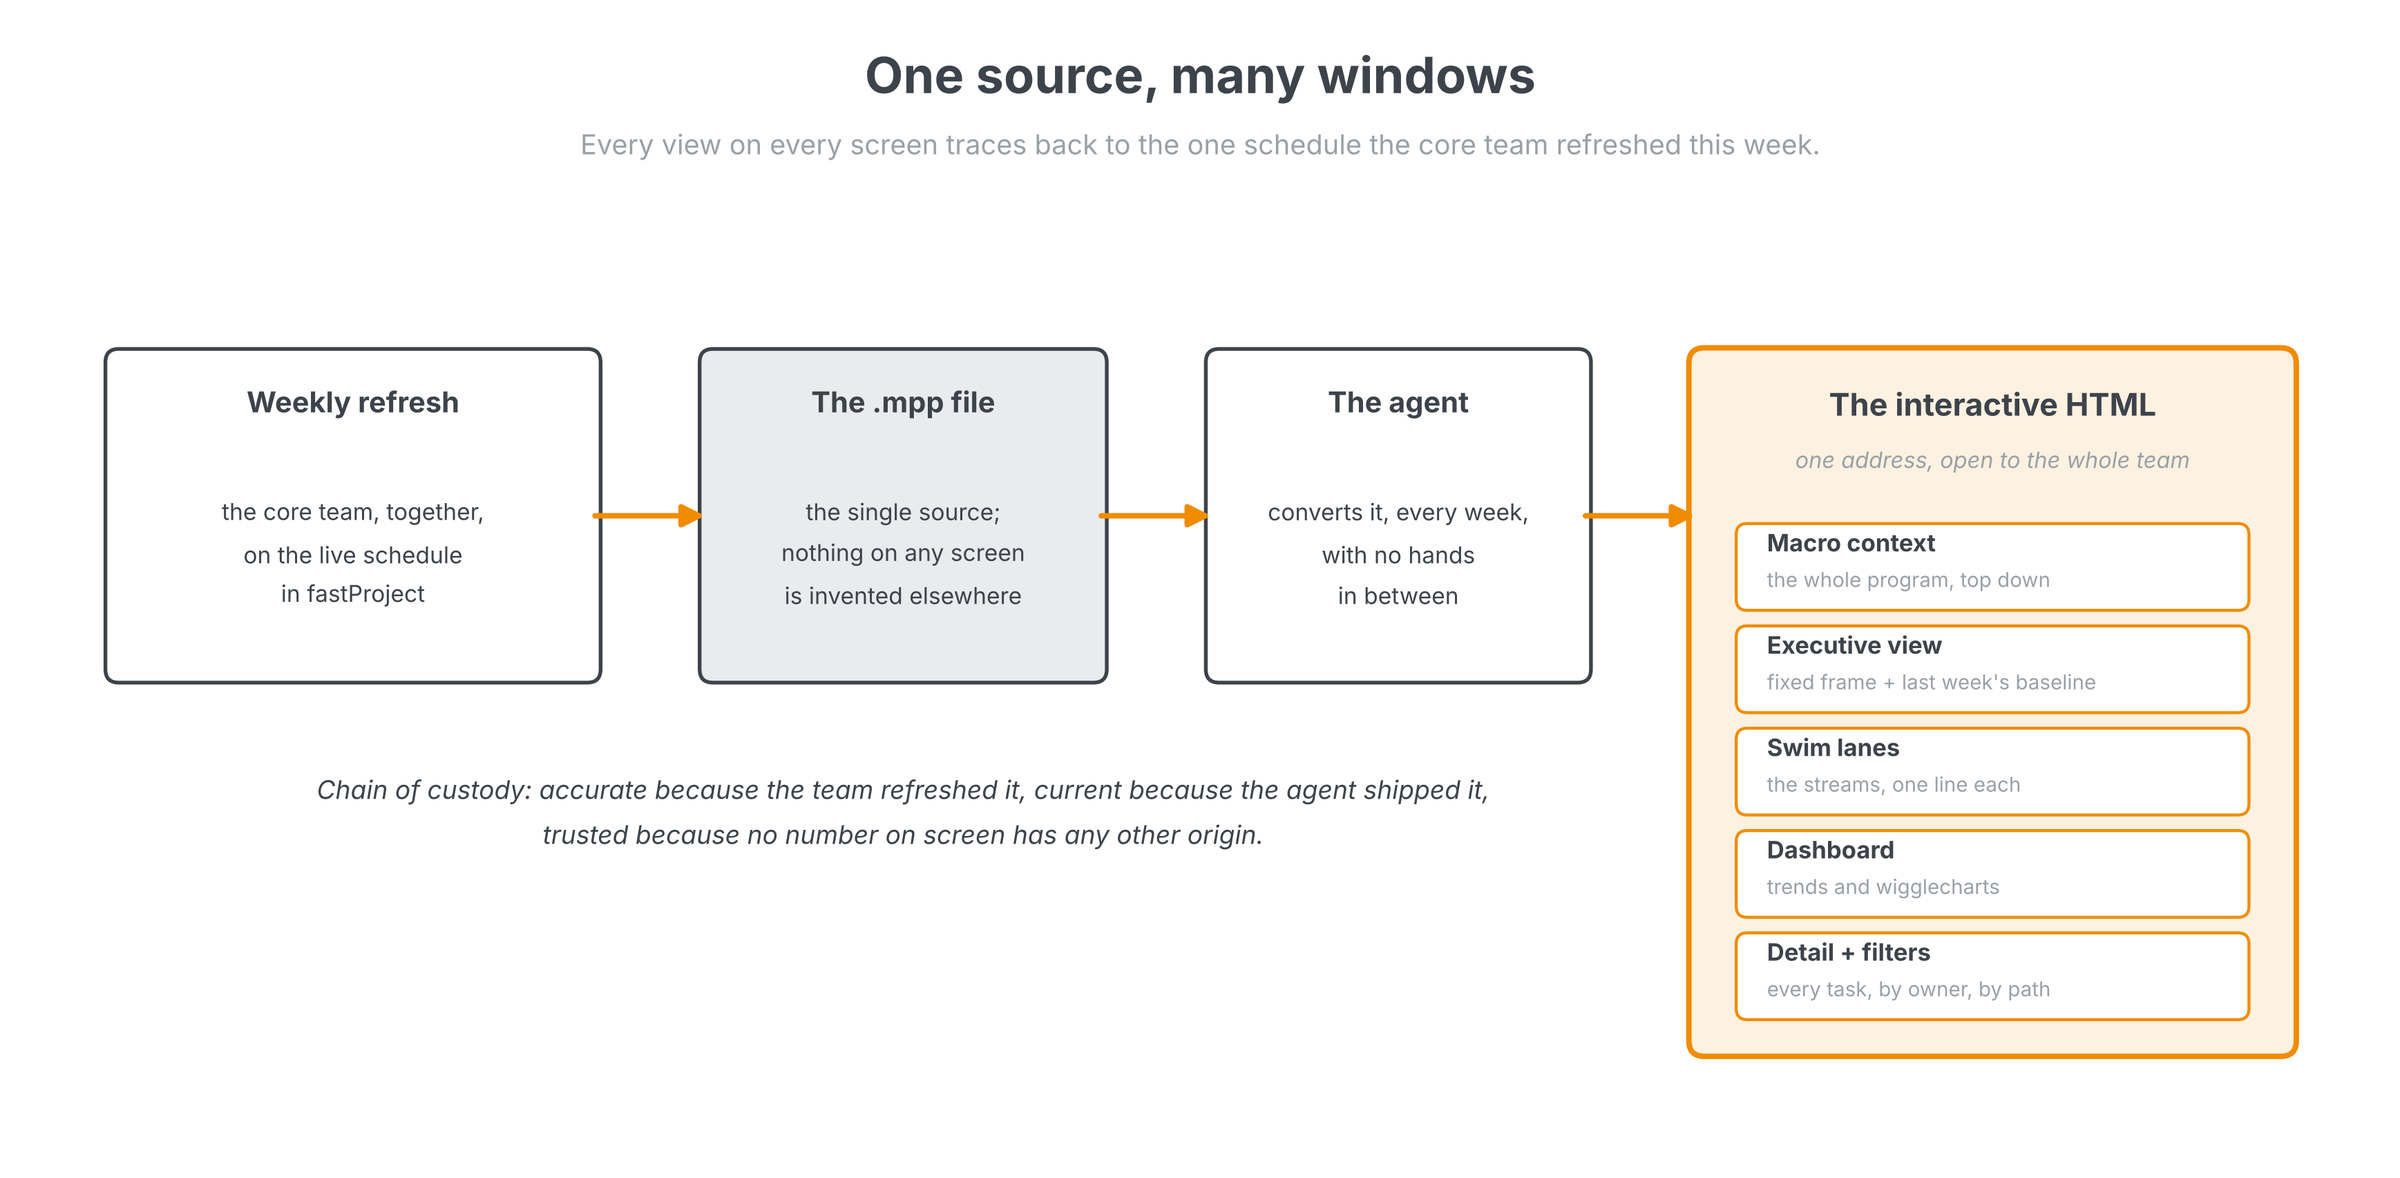
Here is how we now implement this with clients, using tools that did not exist when I was printing that weekly report. What the team gets is an interactive HTML interface, built with Claude Code, living at one address that every team member can open. It has predefined views, each one click: a macro context view of the whole program, top down; an executive view; swim lanes that put each stream on a single line; a dashboard tab with the schedule trends and wigglecharts; and the full task detail with filters by owner and by path for the people who work in the field. The oldest concept in scheduling software, the named view that combines a layout, a table and a filter so the user never has to set up a screen, turns out to be the newest idea in program reporting. It has worked for thirty years, and it still does.
What makes the interface trustworthy is the chain of custody behind it. Every number on every screen originates in one Microsoft Project file (.mpp), the live schedule the core team refreshes together each week in fastProject, the working session we described in The weekly schedule refresh. After each refresh, an agent converts that file into the HTML automatically, no hands in between, so the interface is always current without anyone's intervention. This is where reporting systems usually go sideways: the moment people start inventing numbers outside the schedule, the views stop being windows and start being paintings. And because the interface is generated, it is client specific by nature: each one focuses on the areas that client wants to see, and when someone asks for a new view, adding it takes minutes rather than a tool purchase.
The fixed frame
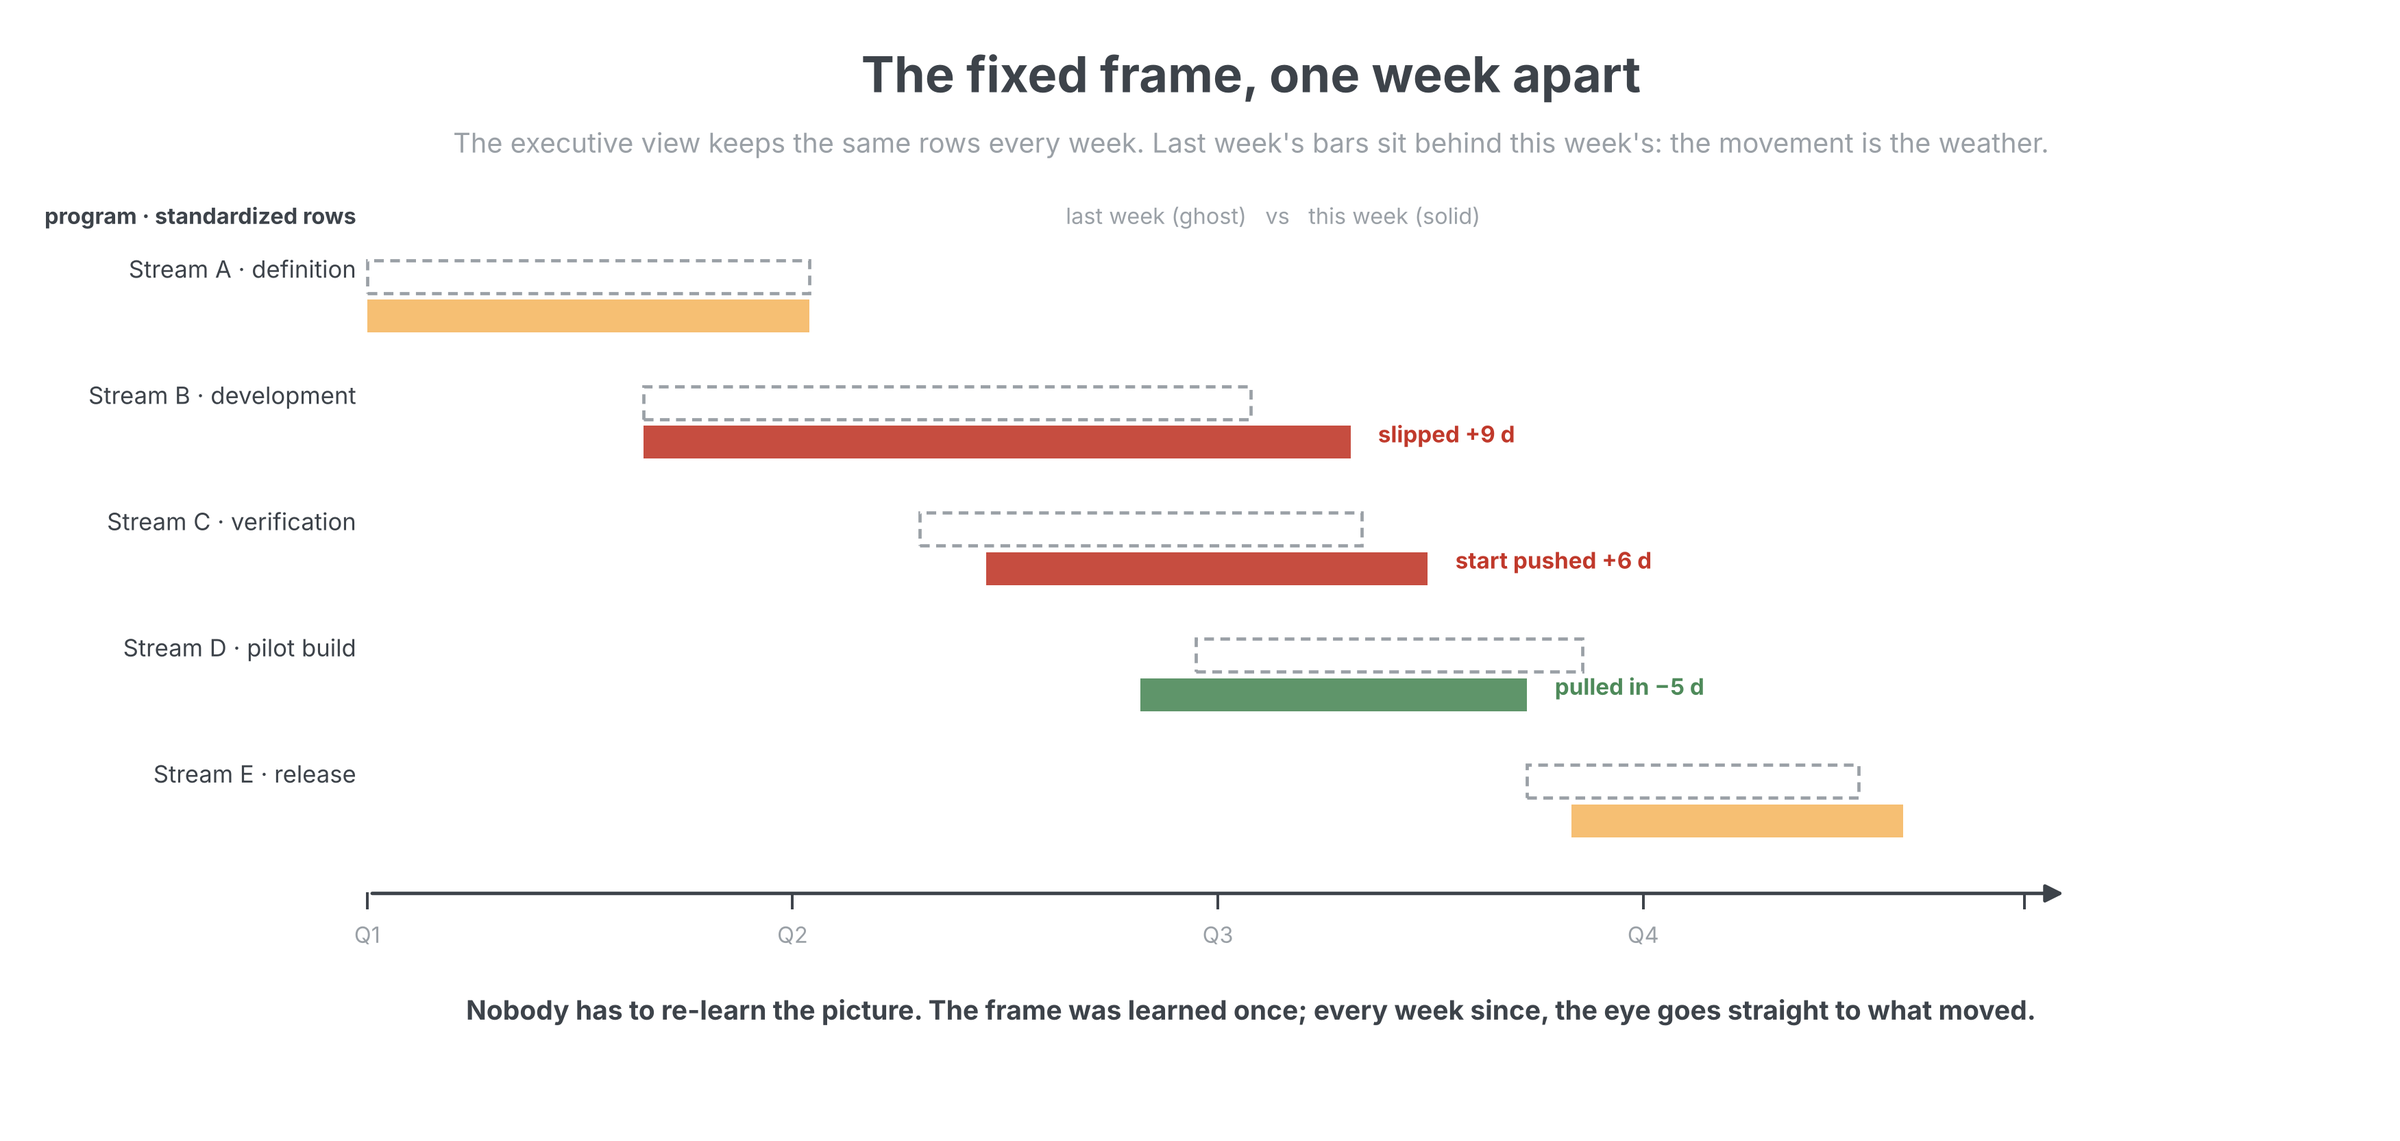
The hardest-working view is the executive view, and it obeys the window rule strictly. It is set up once, as a fixed set of the program's major groupings and milestones, and after that its structure never changes. The only thing that moves is the data, and to make the movement visible we draw last week's baseline behind this week's bars. The reader gets a reference point for free: same rows, same order, same frame, with the change since last week sitting right there in the gap between ghost and solid. Ship it with a half-hour walkthrough for the whole team, leadership included, and from then on nobody can say they did not know where to look.
You know the system is working when the questions change. People stop asking where things stand, because the window shows them, and start asking for new views: can you add a lane for my area, can I filter by my team. That is usage, and it is also the moment leadership attention becomes cheap enough to spend well, the shift we described in Focus by exception and built into The portfolio trends dashboard. A leader with this interface a click away has no reason to wait for a meeting; if I ran a program with this in place, I would look at it every day.
The weather will change
The program will slip, recover, and slip somewhere else; that is development. The reporting must not add turbulence of its own. So separate the two jobs. Give people status, where we are against where we should be, and give them the context that makes the status mean something: the same window, top down, one source behind it, refreshed every week by the team that owns the work. Then let the weather move. It is the one thing in a development program you can promise will change, and with a fixed frame around it, everyone gets to watch.
Related on lateralworks: Break it down together and What causes delay?
Sources
- Edward R. Tufte, Envisioning Information (Graphics Press, 1990)
- Ben Shneiderman, The Eyes Have It: A Task by Data Type Taxonomy for Information Visualizations (University of Maryland, 1996)
- John Bransford and Marcia Johnson, Contextual prerequisites for understanding: Some investigations of comprehension and recall, Journal of Verbal Learning and Verbal Behavior (1972)