A leader running a development portfolio has one scarce resource, and it is not budget. It is attention. There are only so many hours in the week where the power of the office can be pointed at a problem, so the question that decides whether those hours matter is brutally simple: where do you spend them? Walk the halls and you get anecdotes. Sit through status reviews and you get whatever the slides were built to show. Neither answers the real question, which is the 80/20 question: which 20 percent of the portfolio holds 80 percent of this week's insight?
The answer is not a judgment call. In a portfolio with a real planning system underneath it, the 20 percent is computable, and computing it is what exception reporting is for.
The vital few
The idea is older than most of the tools that ignore it. Joseph Juran, borrowing from Pareto, built modern quality management on the vital few and the trivial many: a small share of causes produces most of the problems. Frederick Taylor said the same thing about management reporting over a century ago in Shop Management: send the executive only the exceptions to standard, the especially good and especially bad, and spare them everything running to plan. Management by exception is not a software feature. It is the oldest answer there is to the arithmetic of limited attention.
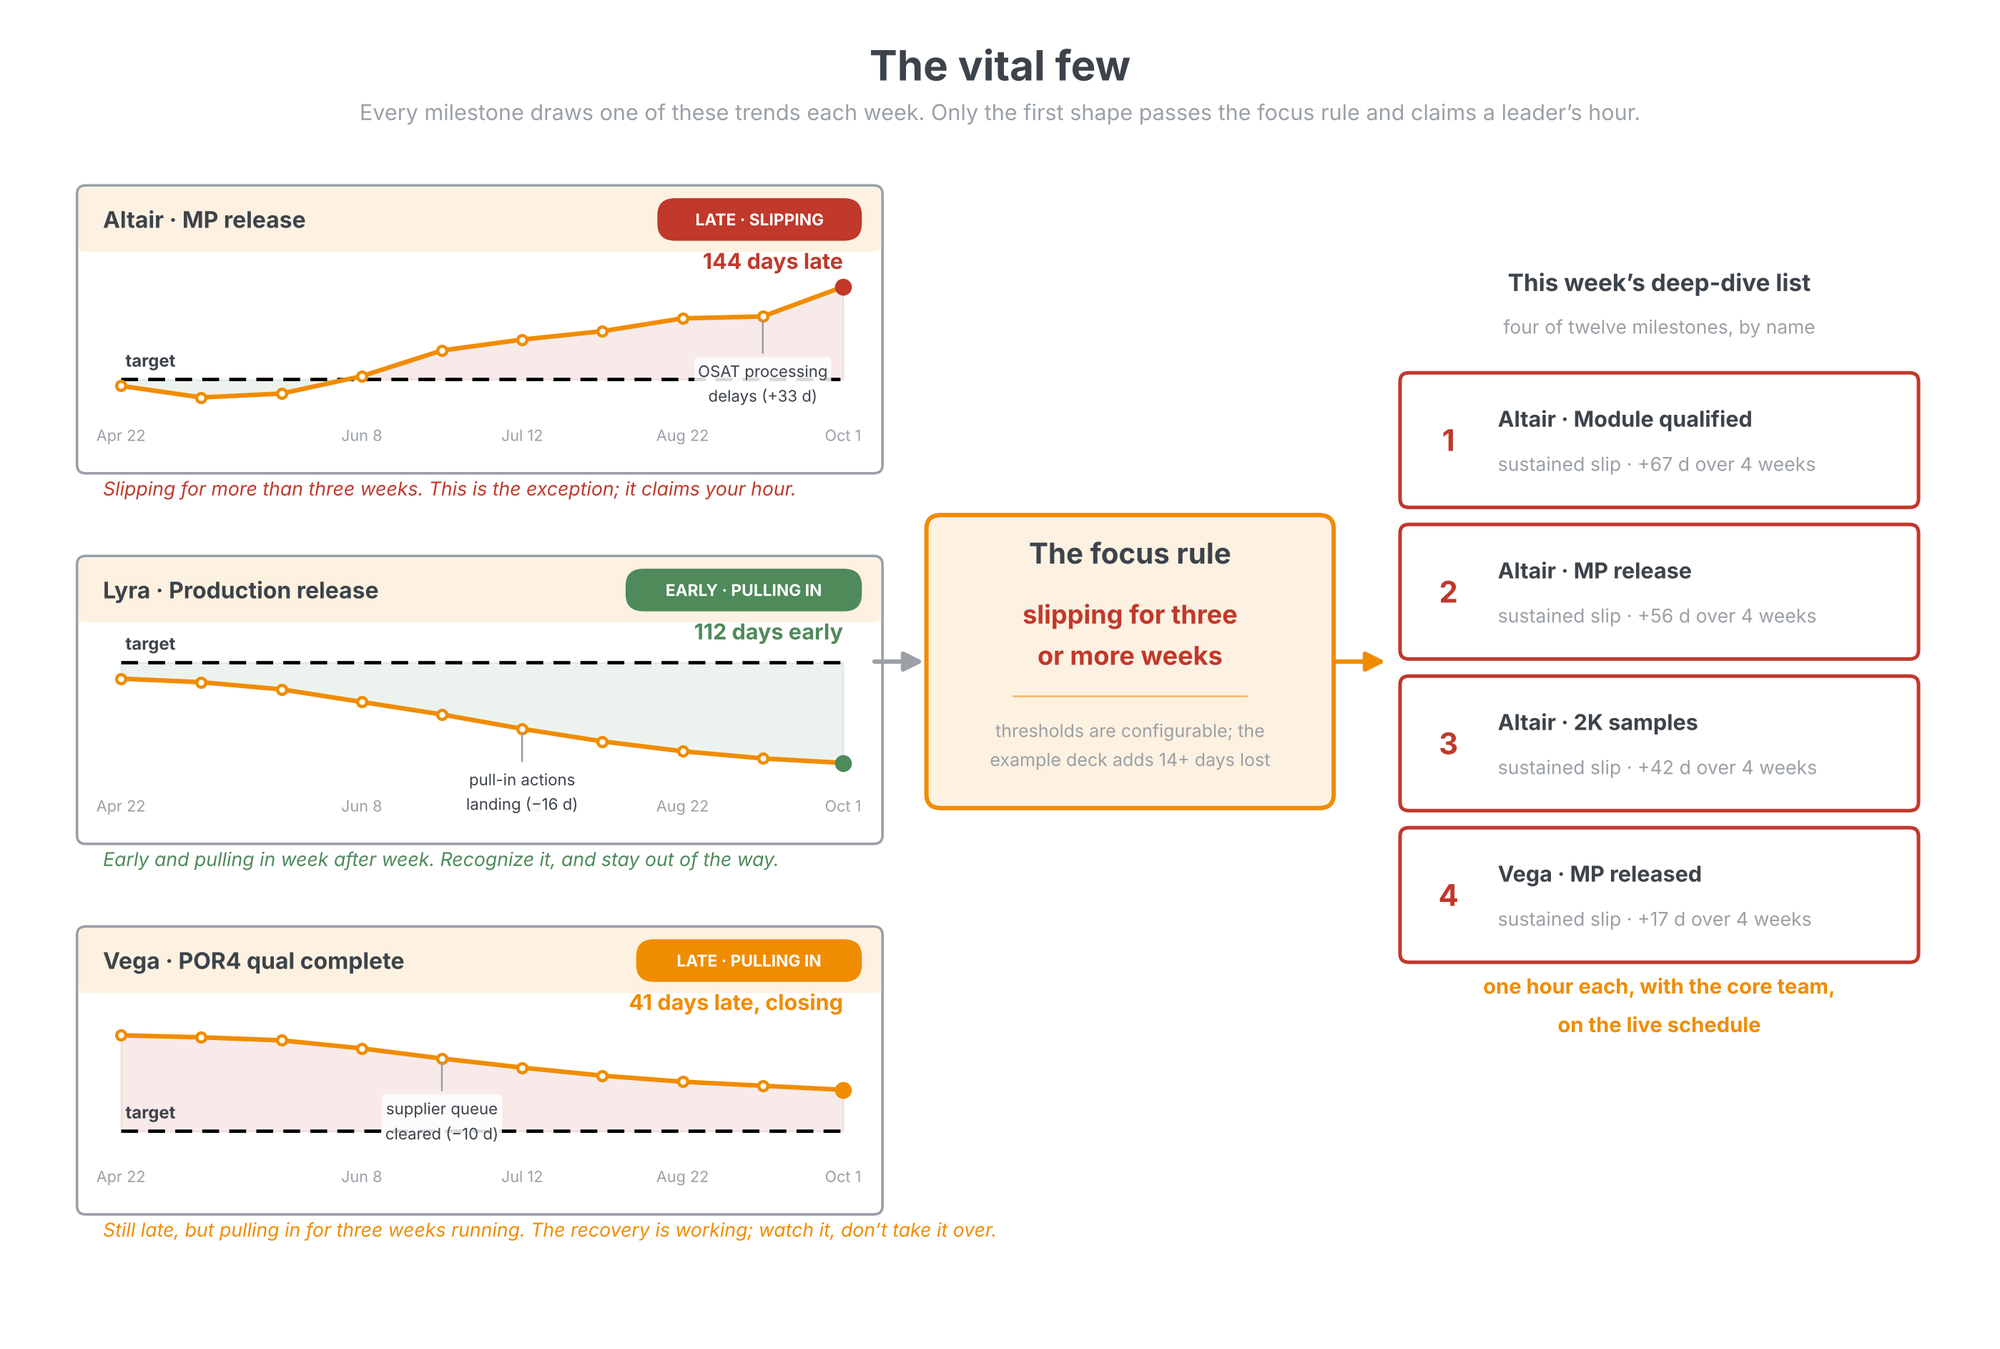
What has changed is that the exceptions no longer have to be nominated by the people being measured. When core teams refresh their fastProjectAI schedules every week, each refresh writes a forecast date for every standardized milestone into the portfolio workbook, and the trend of those forecasts is a measurement, not an opinion. On the portfolio in our example, twelve milestones report every week. The focus rule finds the ones worth a leader's hour: a milestone that has been slipping for three or more weeks. The thresholds are configurable per portfolio; the example deck tunes them to two slips in the last four refreshes with fourteen or more days lost. This week the rule returns four.
An event is not a trend
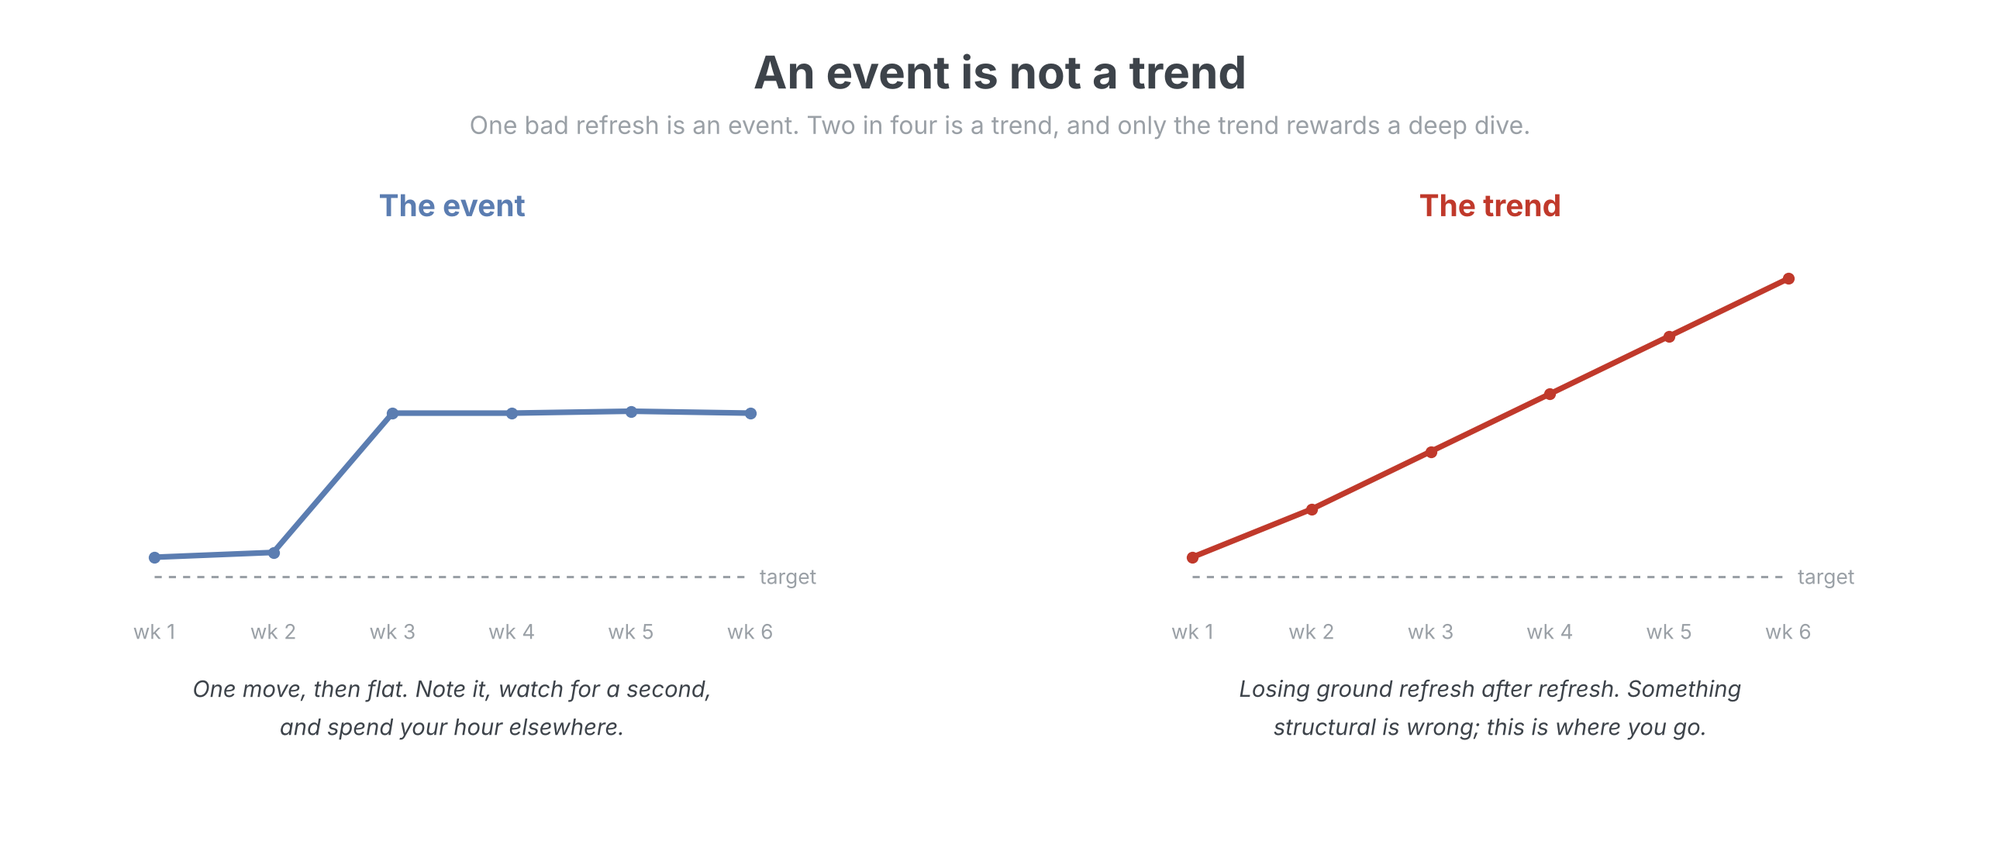
The focus rule has a shape worth understanding, because it is what keeps exception reporting from becoming alarm fatigue. One bad refresh is an event. Events have ordinary explanations: a holiday, a late update, a real slip already being handled. A milestone that slips once and holds gets noted and watched, not convened over. Three weeks of slipping is a trend, and a trend means something structural is pushing the date, week after week, that the team has not been able to stop on its own. Only the trend rewards a deep dive. The single large moves and the slow drifts are listed underneath the exceptions, not dropped, so nothing disappears; they are simply not this week's claim on your hour.
This is the same discipline we argued for in Report by exception: a status report earns its place in a leadership meeting by what it leaves out. A snapshot that colors nine of fourteen programs red tells you nothing about where to spend the next hour. A trend that names four milestones tells you exactly.
The one-page answer
Here is what the answer looks like in practice: one page, generated weekly, no one assembling it. For each exception it shows the gap to target, the four-week pattern, the root cause quoted verbatim from the team's own workbook, who leadership needs in the room, and the overdue actions to ask about. Everything on it is read directly from the fastProjectAI schedules and the wigglechart workbook the teams already maintain. Nothing is fabricated and nothing is filtered; the page is extracted automatically and refreshed weekly without manual intervention, by the same Claude skill that builds the weekly portfolio dashboard. That article is this one's companion: it walks through the full weekly deck; this is the page in the deck that tells leadership where to go.
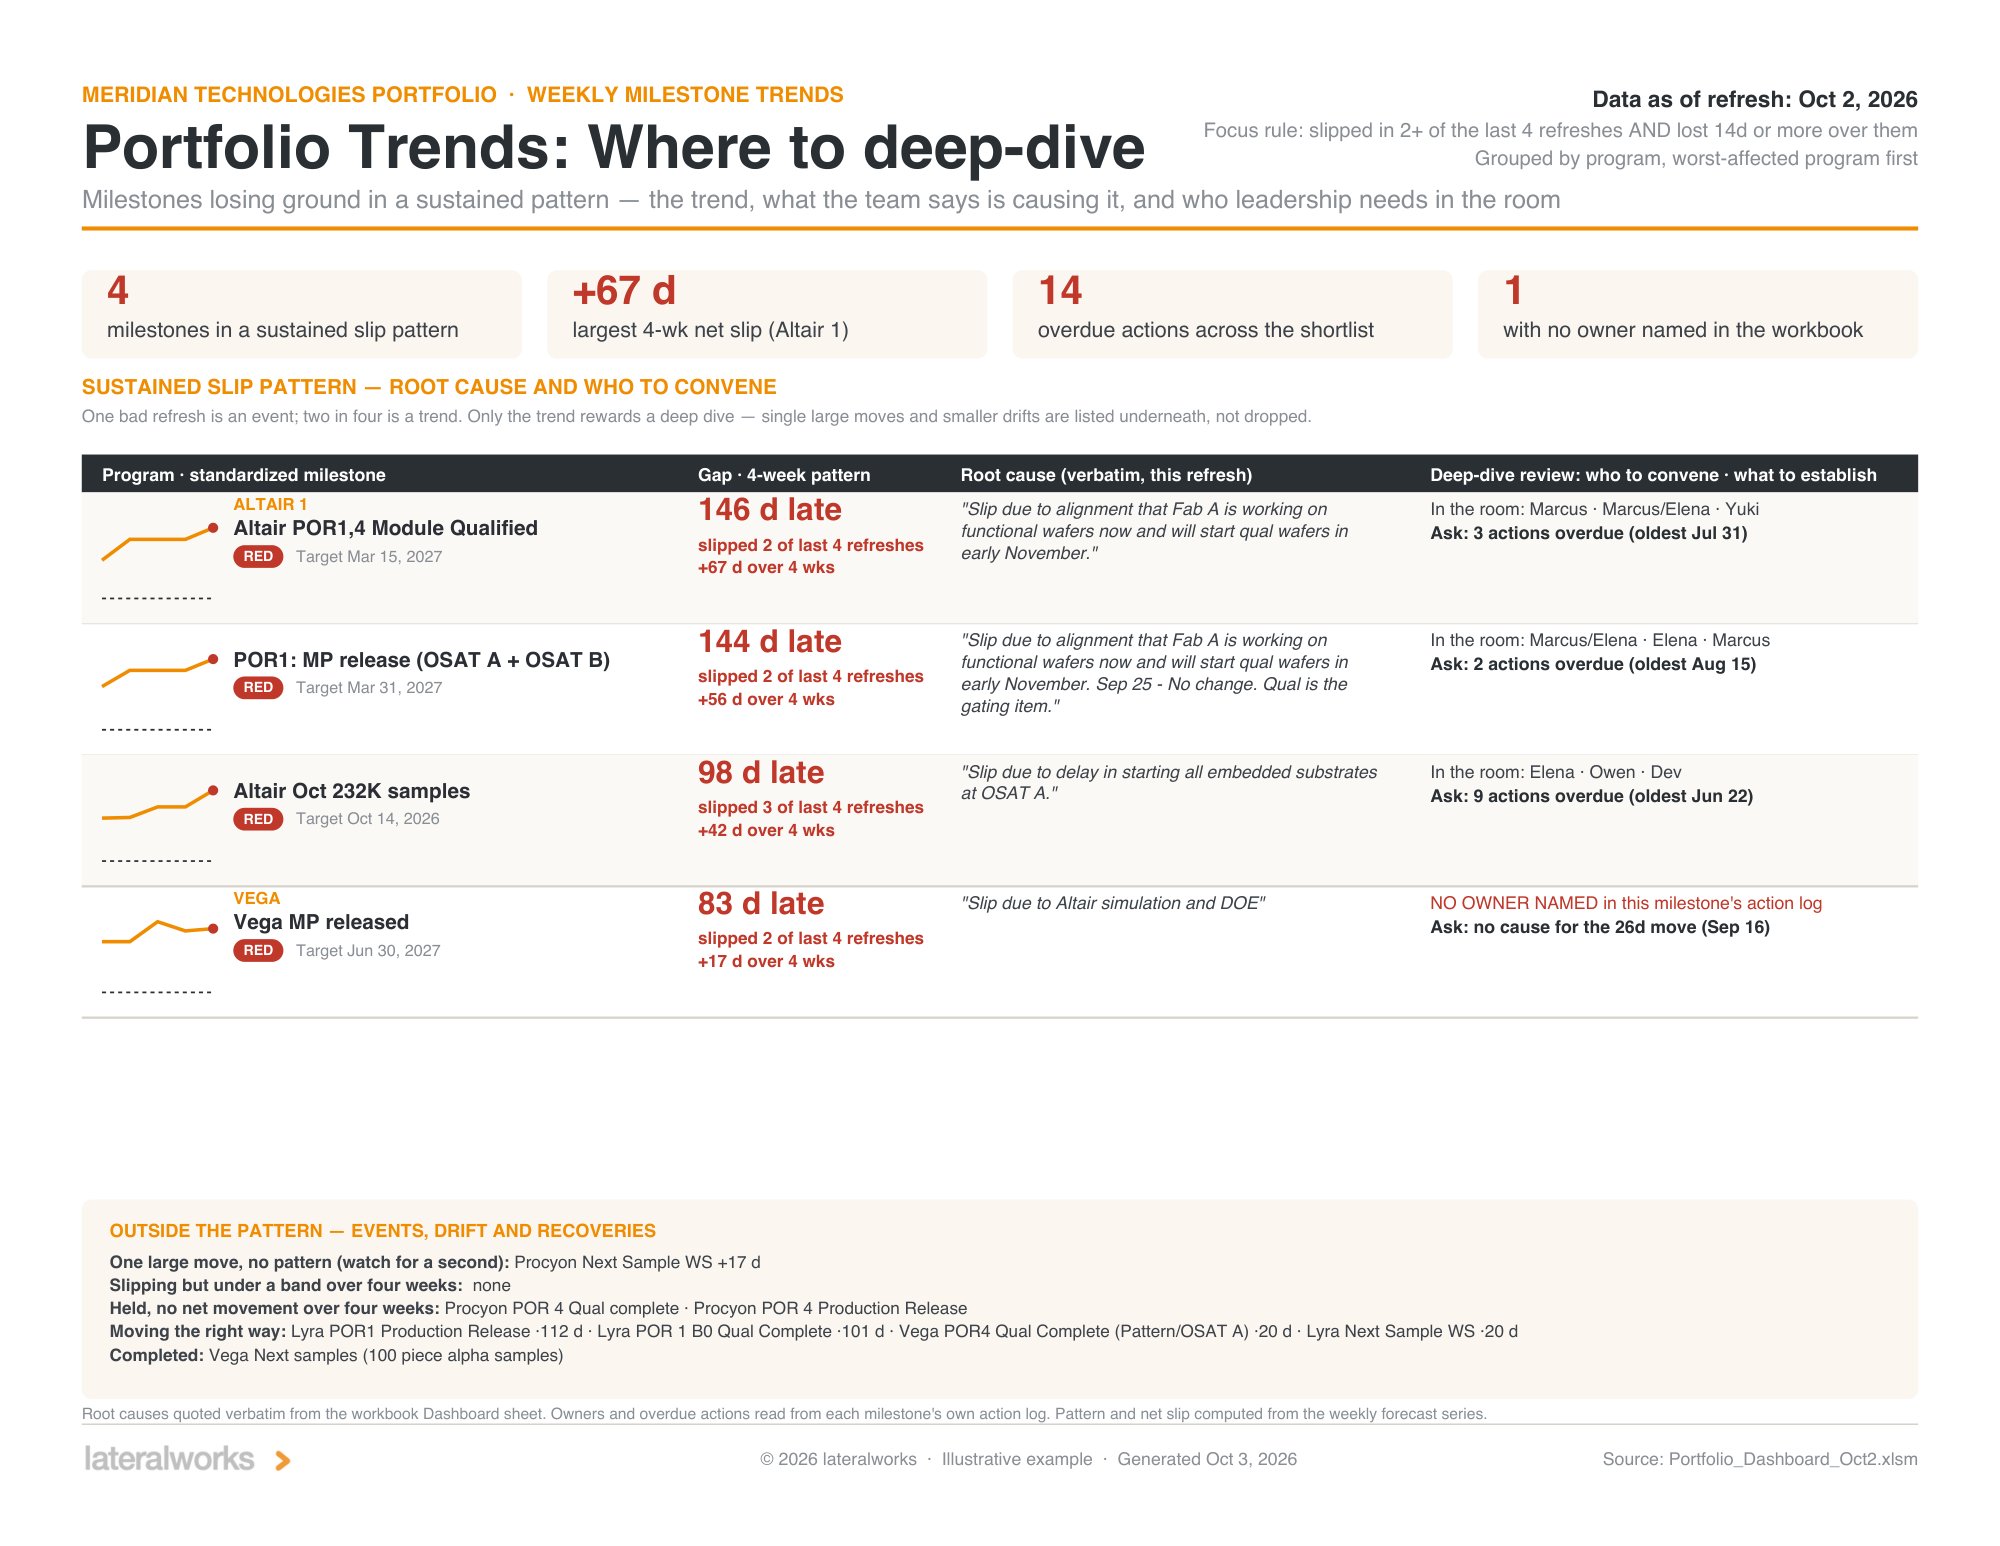
Notice what the page does not do. It does not score anyone. It does not re-color the portfolio. It quotes the team's own stated cause next to the trend, names who should be in the room, and surfaces the actions already overdue, the oldest with its date. The page is an agenda, not a verdict, and that distinction is the entire reason it works; the trend data comes from the same wigglechart discipline the teams run for themselves.
The deep dive
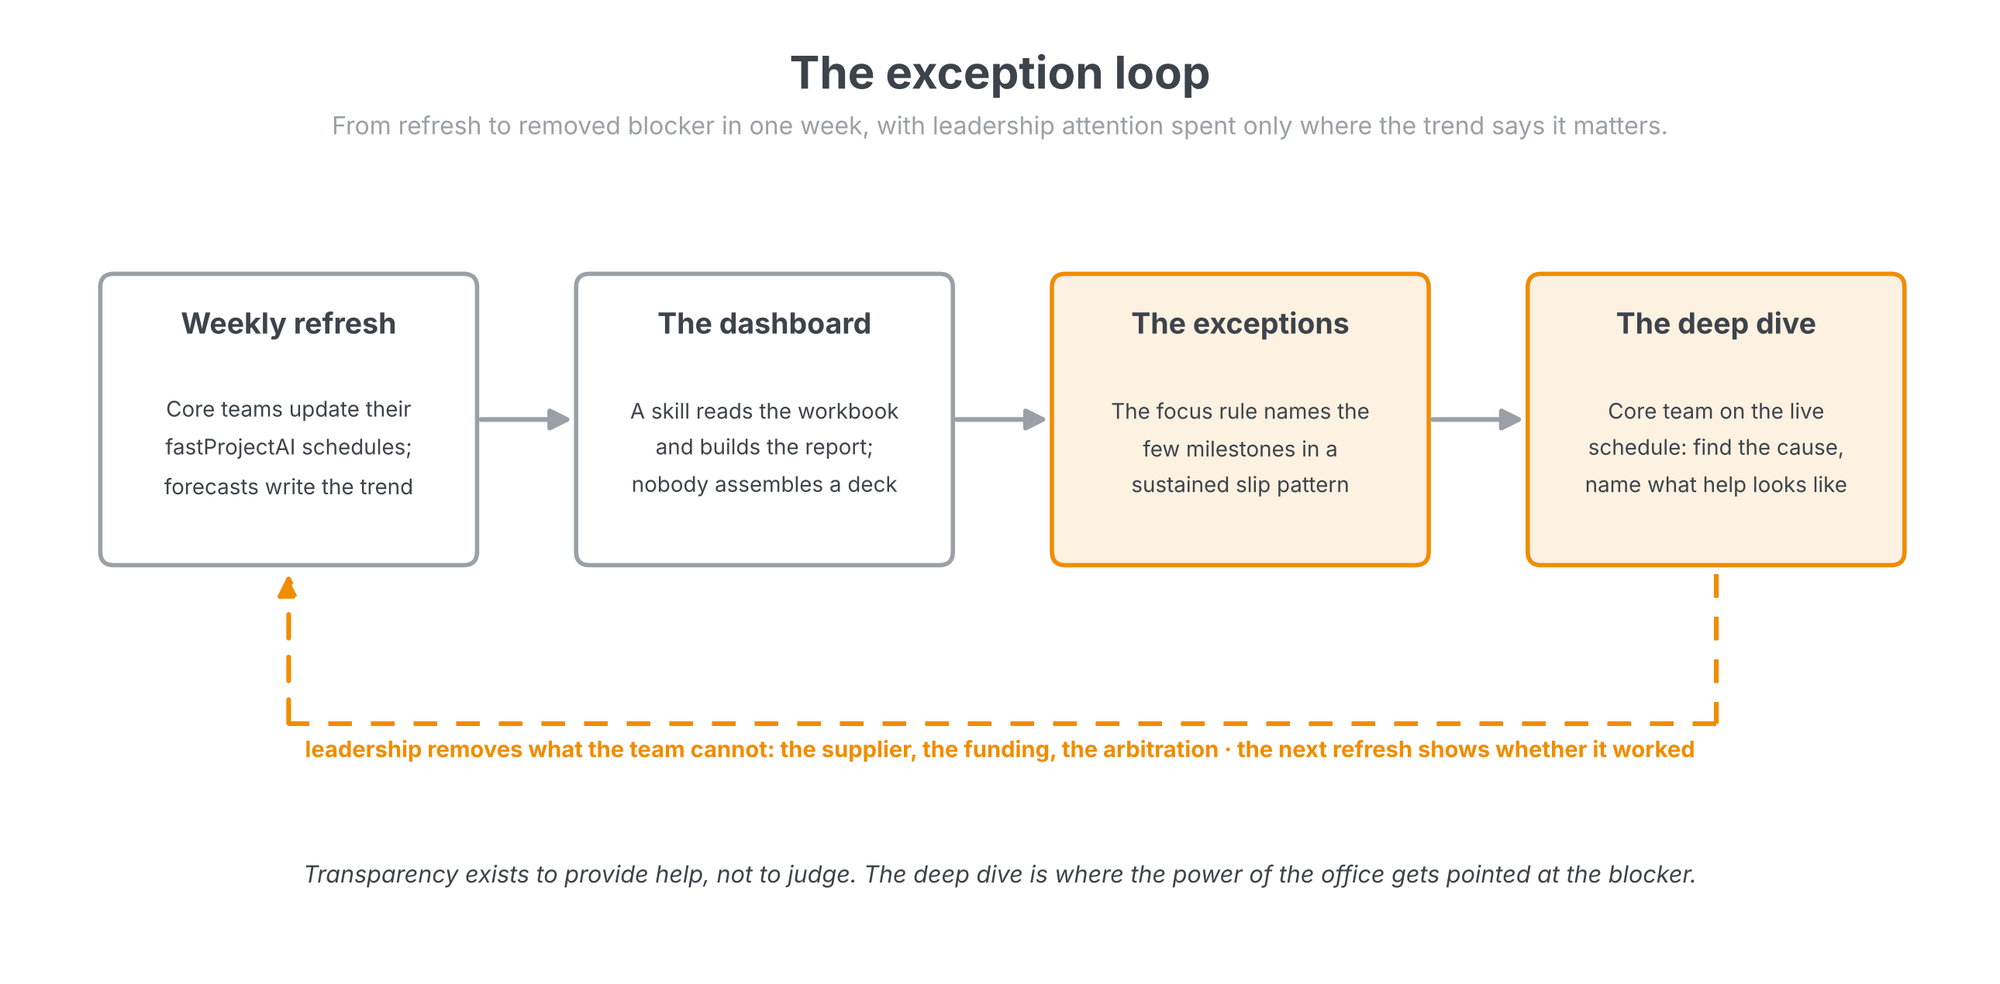
The exception list is only half the method. What you do with it is the other half, and the instrument is the live schedule, not a slide about it. Convene the core team of the slipping milestone, for an hour, in front of the fastProjectAI schedule. Ask the questions the trend raises and let the team answer from the plan: what is driving the date, where the critical path runs through the slip, which task started it, what has to be true for the trend to reverse. Teams can show you what is happening in the schedule in a way no status deck can, because the schedule is the thing itself. We wrote the question set for this session in Analysis starts with questions, and the portfolio-level patterns those questions keep finding in What causes delay.
Timing is the point of the whole apparatus. A trend caught at two refreshes is weeks younger than a slip explained at a quarterly review. Get to the cause early and the fix is still cheap: the supplier escalation still has runway, the resource conflict can still be arbitrated, the scope decision can still be made deliberately. Get them early, and you improve your chances of finishing on time. That is the entire business case for the dashboard.
Help, not judgment
Everything above collapses if the deep dive is experienced as an audit, and this is the FTTM principle underneath the whole system: transparency exists to provide help, not to judge. The deep dive is not micromanagement, and the difference is observable in what leadership does at the end of the hour. The removal list is the tell: the supplier who needs a call at a level the team cannot reach, the nine unfunded seats, the cross-program resource conflict nobody below the portfolio has authority to arbitrate. Teams figure out within two or three deep dives which kind of leader walked in, and the quality of what they surface adjusts accordingly; we watched that dynamic decide a program.
The test at the end of the hour
A micromanager leaves the deep dive with a list of things the team must do differently. An exception-driven leader leaves with a list of things the office will remove. Teams that trust the transparency show you their problems while the problems are small. Teams that fear it show you green until the date is unrecoverable.
The arithmetic of attention
So, where to focus when you can only focus on a few things? Let the trend nominate them. Four milestones out of twelve, an hour each with the core team on the live schedule, a blocker removed per session: that is a leadership week that moves finish dates. The alternative spends the same hours spreading shallow attention across everything that is mostly fine, which is how portfolios end up surprised by slips their own data had been signaling for a month. The 20 percent is sitting in the workbook, recomputed every Friday. The only question is whether anyone with power reads it.
Related on lateralworks: The weekly schedule refresh and Cost of delay.