Most product teams know their budget to the dollar and cannot say what a day of delay costs. Fast teams can. They state, in dollars of lost profit, what happens when their launch slips by one day, they use the number to settle tradeoffs, and they use it to keep the work urgent long before a deadline is in sight. We found this habit in our original research into fast product teams, and it is still rare: Don Reinertsen reports that 85 percent of product developers do not know the cost of delay for the projects they are working on.
This article shows the practice at portfolio scale, from a client example: a portfolio of five products used in AI data centers, a market with huge unit volumes and serious urgency, where customers do not wait. The client's identity is withheld; program names and every figure are changed, so treat the numbers as an illustration. The structure is real, and the full paper and the nine-page example dashboard are downloadable below.
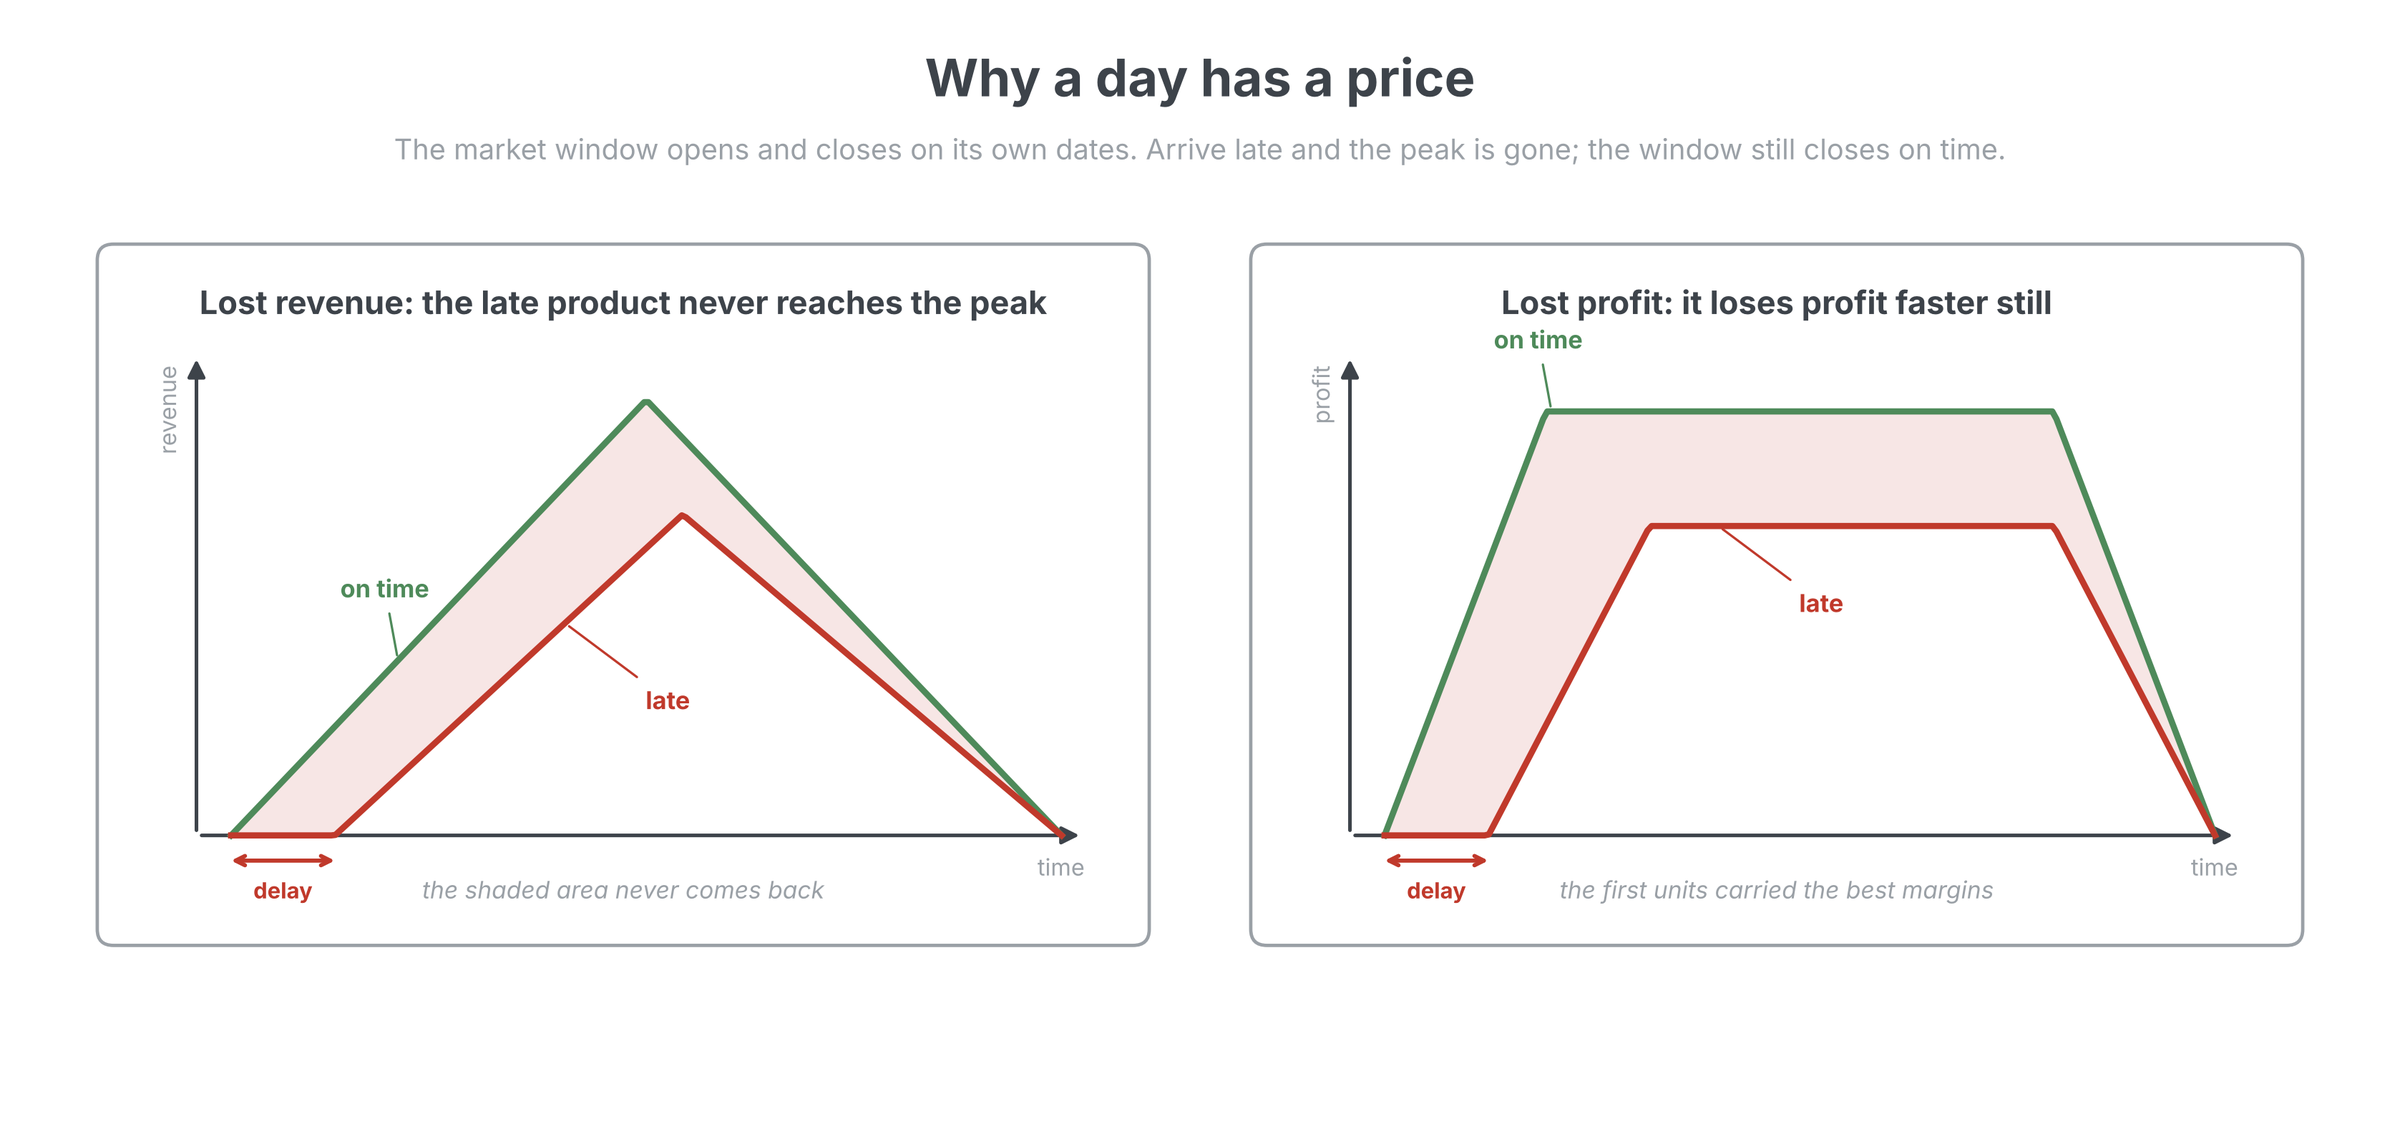
Why a day has a price
Time to market is a development period followed by a market window, and the window opens and closes on its own dates. A team that arrives at the front of the window sells at the highest prices for the longest time. A late team sells fewer units at lower prices, and the window still closes on the same date, which is the heart of the right-time problem. Late entry loses revenue across the whole sales life, because the late product never reaches the peak the on-time product would have reached, and it loses profit faster still, because the first units into a new window carry the best prices and margins. The published evidence is blunt about the asymmetry: a McKinsey study reported in Cohen, Eliashberg and Ho found that shipping six months late cost a product 33 percent of its after-tax profit, while overspending the development budget by 50 percent cost 3.5 percent. Most schedule arguments are fought over the wrong number.
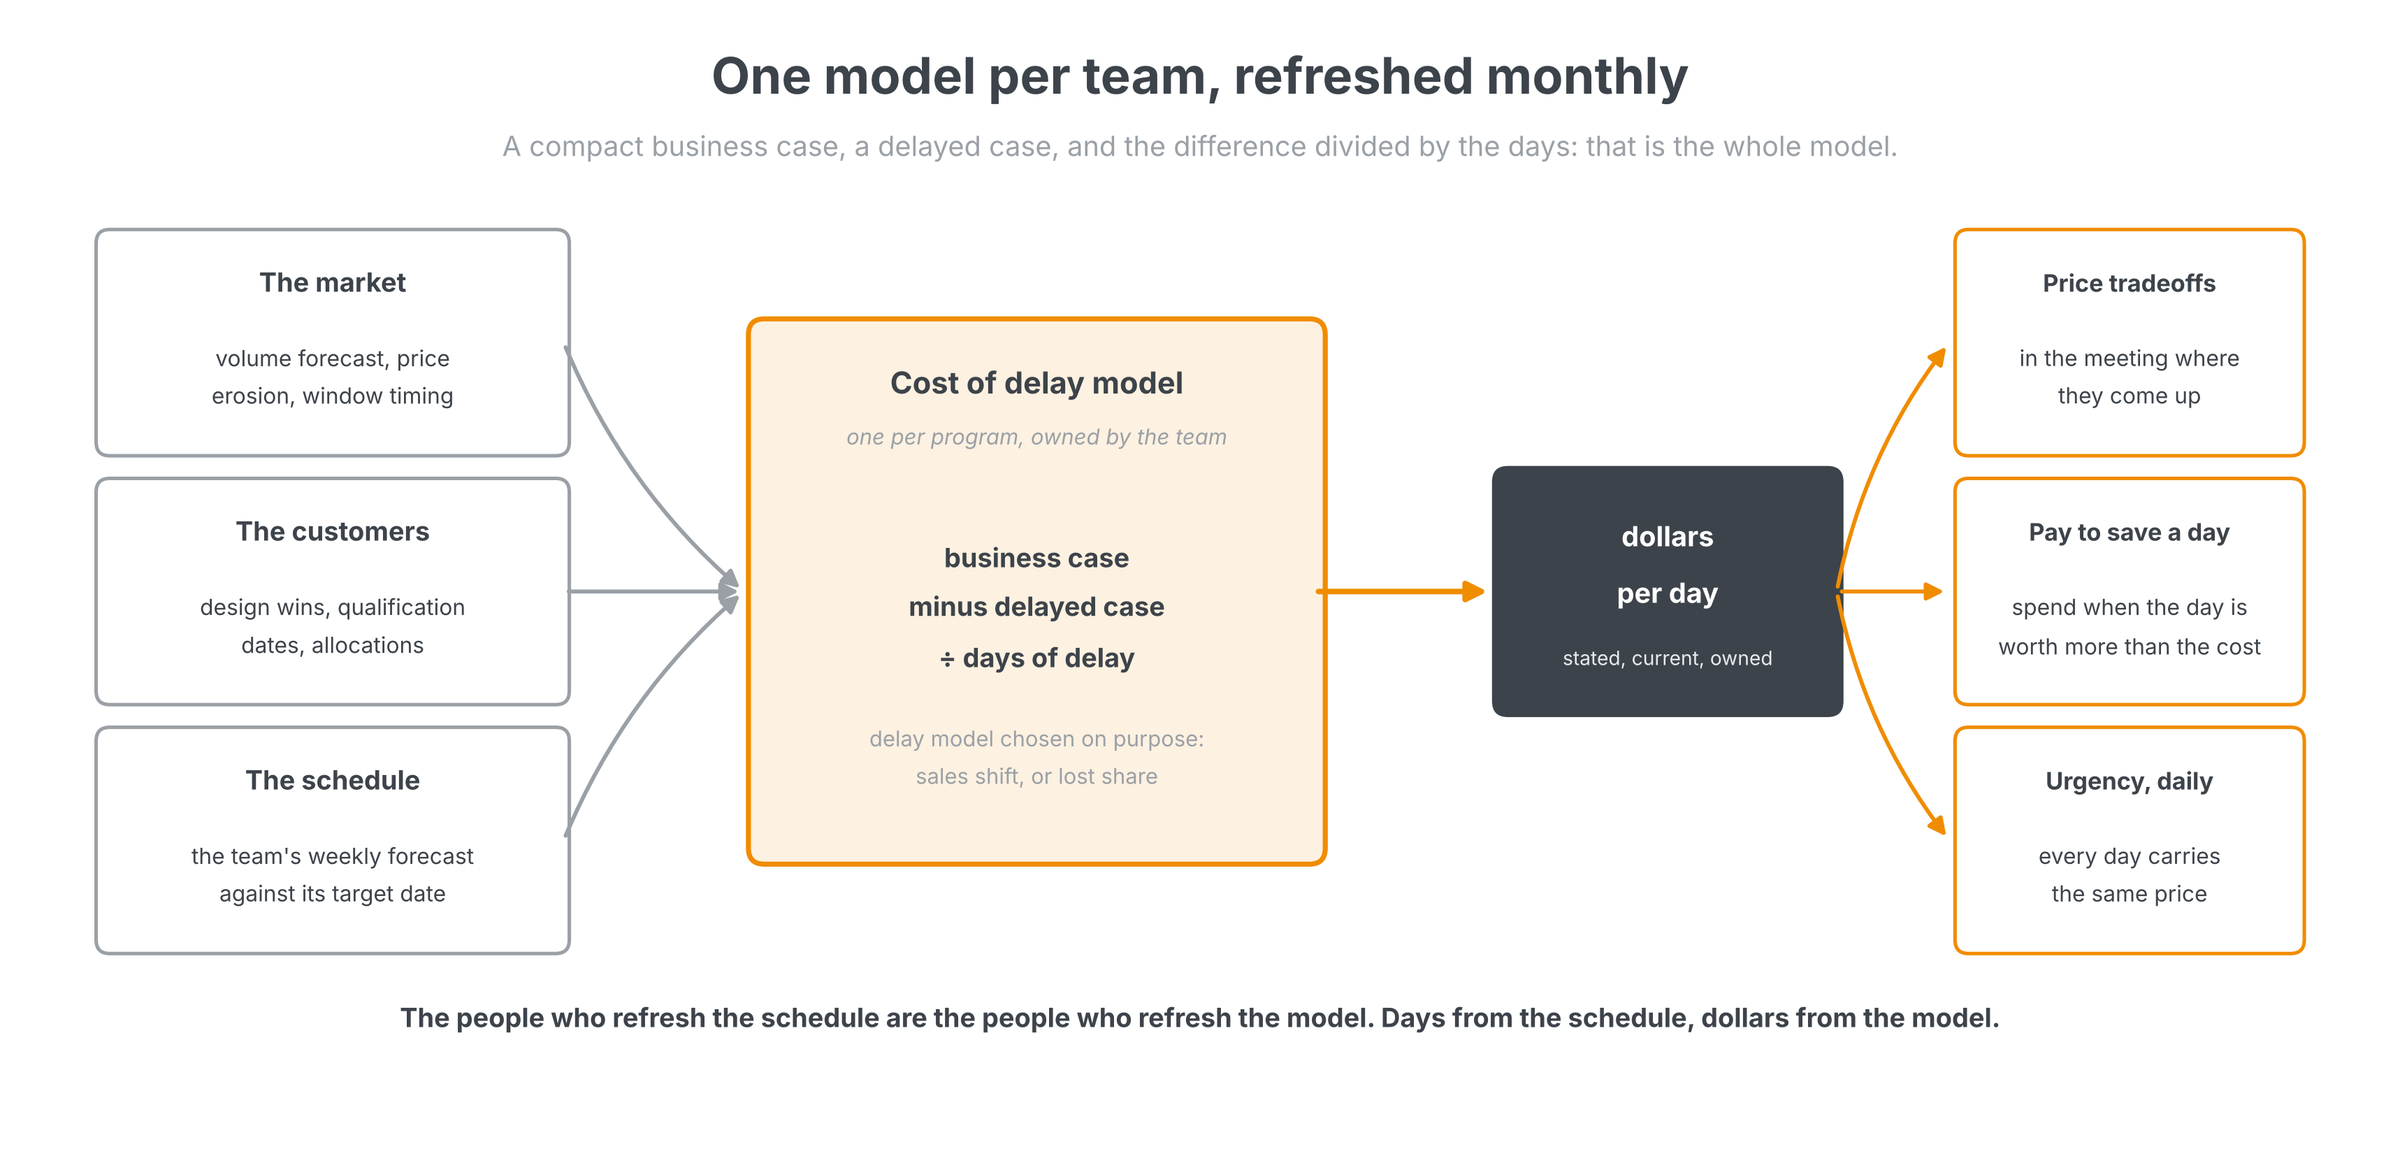
One model per team, refreshed monthly
The portfolio number is not produced by finance once a year. It is a synthesis of five project cost of delay models, one per program, each owned by its project team and developed with lateralworks. A model is a compact business case: unit sales, selling price and cost of goods by year, the R&D budget, and SG&A. A second case applies the delay. The difference in net profit between the two cases, divided by the days of delay, is the cost of delay per day. That is the whole model, and it is deliberately small enough for the team to own. It is also a tool, not a template: the model lives in Cost-of-delayAI, an Excel workbook we developed for exactly this job. Cost-of-delayAI is a function of the fastProjectAI suite, shipped in the Project Manager Notebook alongside the fastDecision models, the interrupt matrices and the risk registers, so every team prices its program in the same worksheet it will refresh.
The teams refresh their models every month, because three kinds of information keep changing: the market (volume forecasts, price erosion, the timing of the window), their customers (a design win or a moved qualification date changes what a late arrival would forfeit), and their own fastProject schedules, where the weekly refresh supplies the current forecast against the target date and therefore the days at stake. The people who refresh the schedule are the people who refresh the model, and that is why the number gets used instead of quoted: a figure handed down once a year appears in reviews, while a figure the team rebuilt last month, from its own schedule and its own customer conversations, shows up in decisions.
What the dashboard says
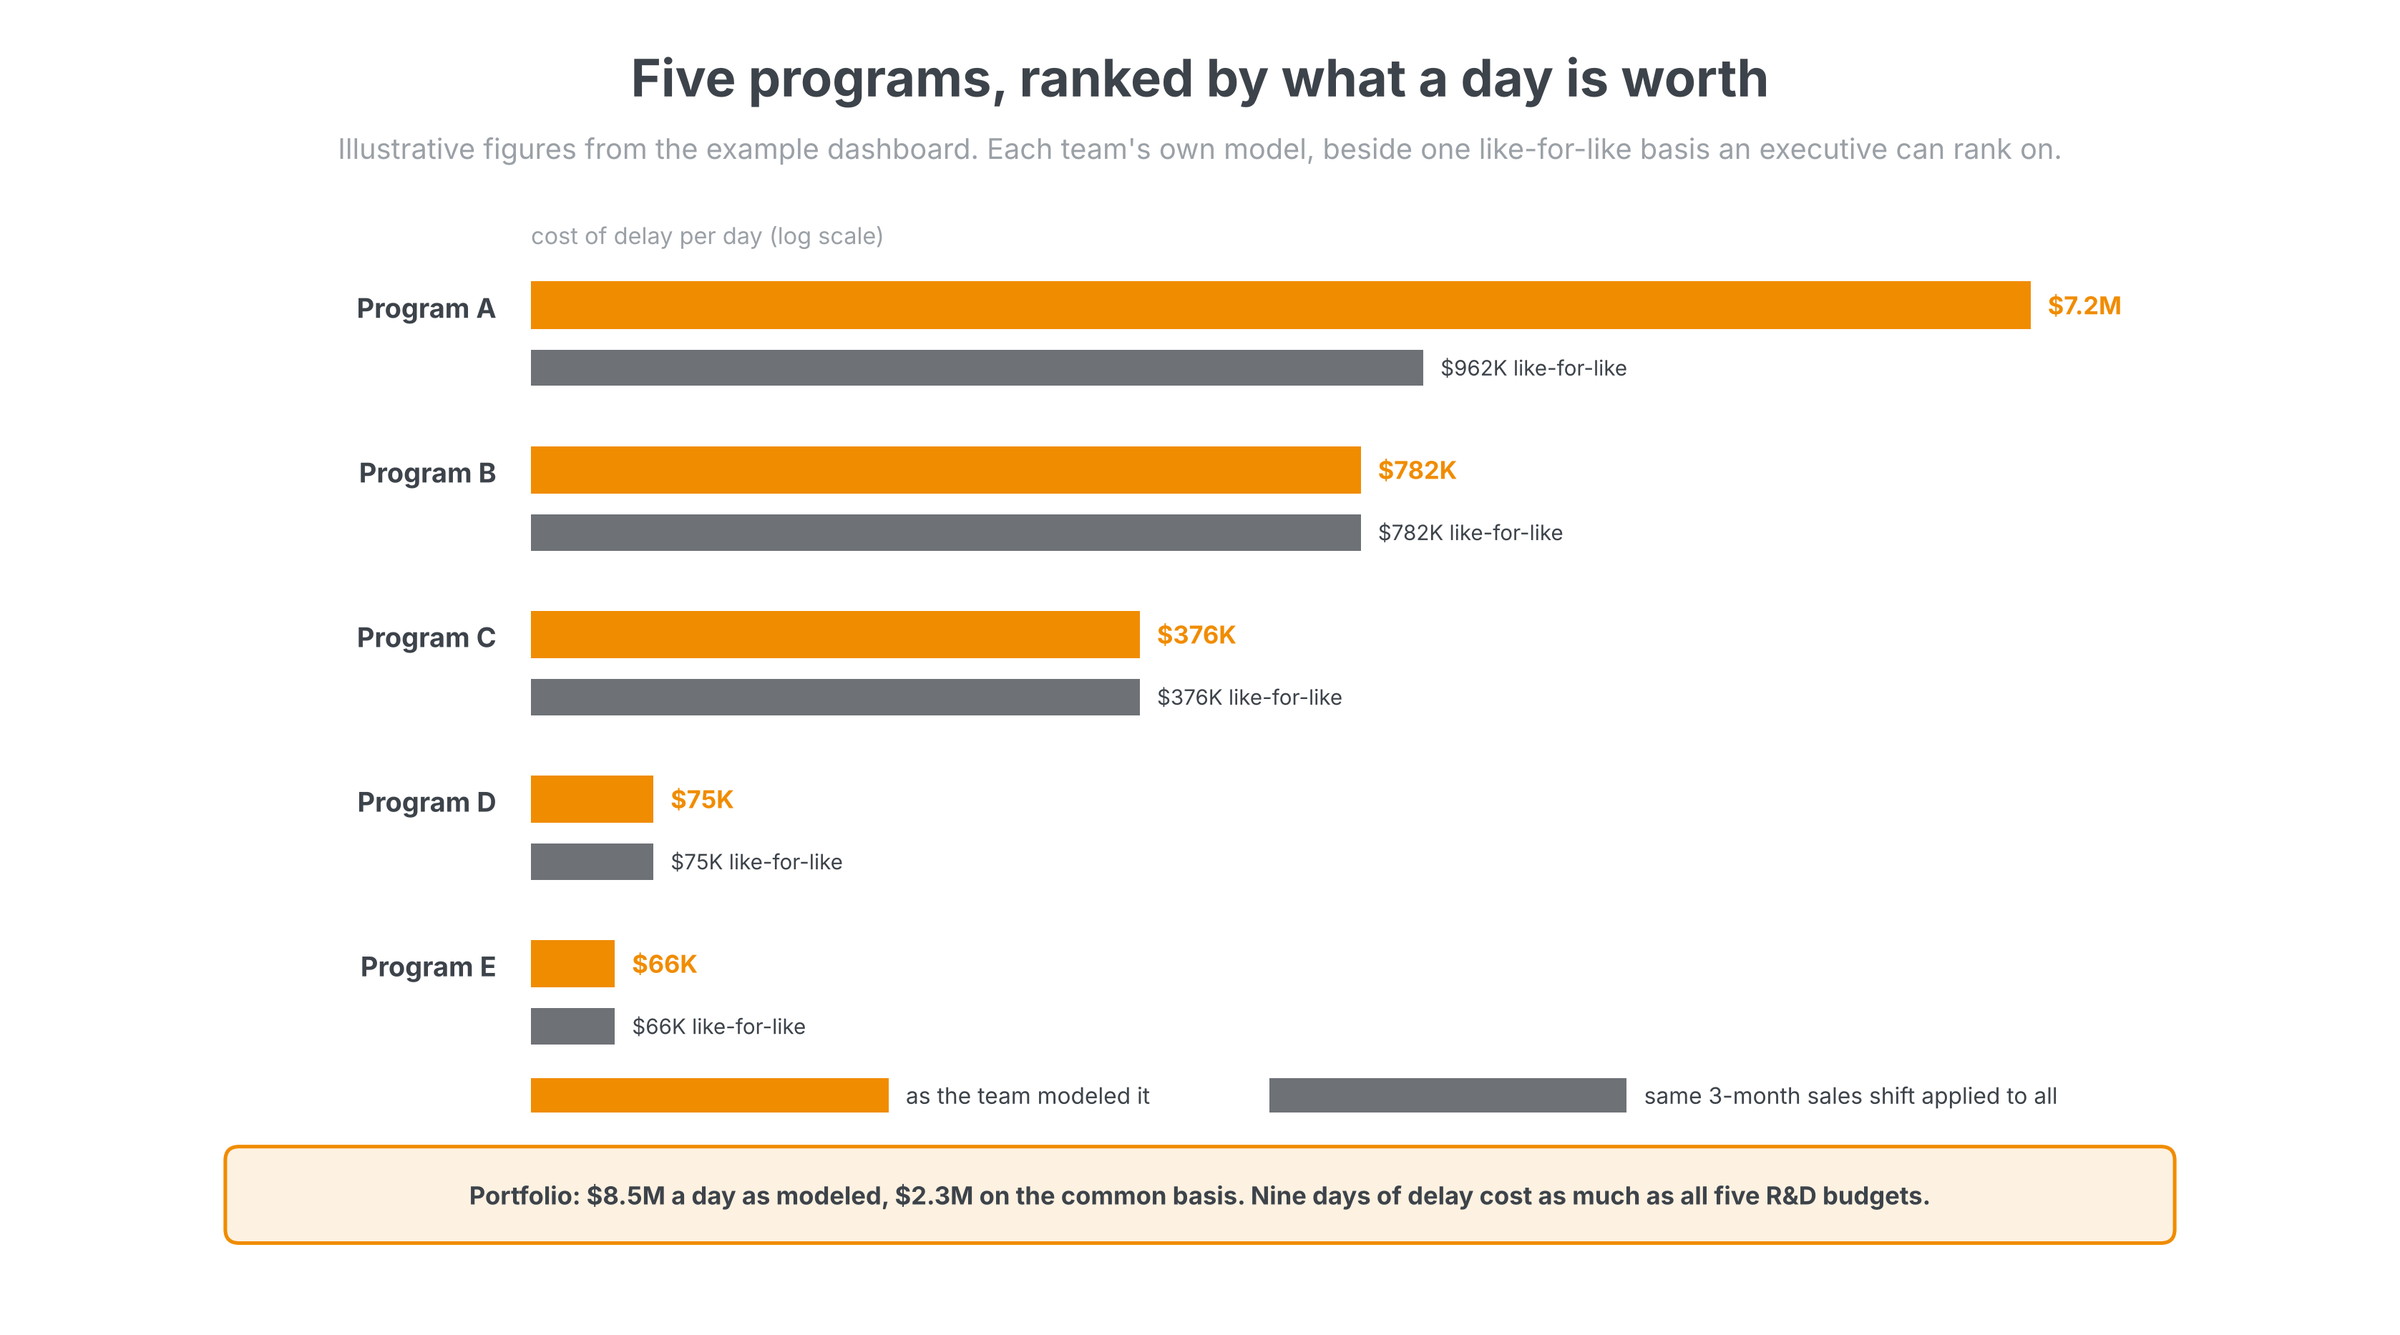
The portfolio view is where we put Claude to work. We developed a Claude skill that reads the five team workbooks and synthesizes them into the executive dashboard, and a Claude agent schedules the job, running it monthly as the updated workbooks land after each team's refresh. No figure on the dashboard is typed by hand; every number is read from a team's model and recomputed from the model's inputs before it prints. In the illustrative version, a day of delay across the five programs costs $8.5 million in net profit, and a month costs $255 million. The R&D budgets of all five programs total $78.1 million, so about nine days of delay cost as much as all the development money in the portfolio. One program carries 85 percent of the daily figure. And because teams legitimately model delay differently, the dashboard also applies one common delay model to every business case: on that like-for-like basis the portfolio costs $2.3 million a day, and the spread between the most and least expensive program is about 15 to 1, against more than 100 to 1 as modeled. That spread settles priority calls that otherwise go to the loudest voice.
Three ways the number gets used
First, tradeoffs get priced in the meeting where they come up. Midway through one program, a customer asks for added functionality. Marketing believes it supports a 3 percent higher price; engineering estimates 2 percent more cost of goods, $2 million more R&D, and six weeks of schedule. Read off the model, the price is worth $64 million, the cost of goods takes back $27 million, the R&D $2 million, and the six weeks $35 million: a feature that looked like an easy win nets to about zero once the delay is priced. The useful question becomes whether the team can deliver it without the six weeks, and what that would be worth paying for, which is the no-tradeoff paradigm with arithmetic attached.
Second, the same number sets the price a team should pay for speed. A day on that program is worth $782,000, so an expedite fee of $250,000 that saves five days returns $3.9 million. In an organization run on annual functional budgets, that request stalls, because the fee is visible and the five days are not. With the model in hand, the approval takes one conversation, and a day pulled in is treated the same way: it is worth about what a day lost costs, which is the economics behind pulling in before you slip.
Third, shared resources go where a day is worth the most. Programs in a portfolio compete for the same specialists and the same lab time, and the dashboard states the rule on its first page: when two programs need the same resource, the higher cost per day goes first. The argument that used to take a week of escalation becomes a lookup.
Urgency without a deadline
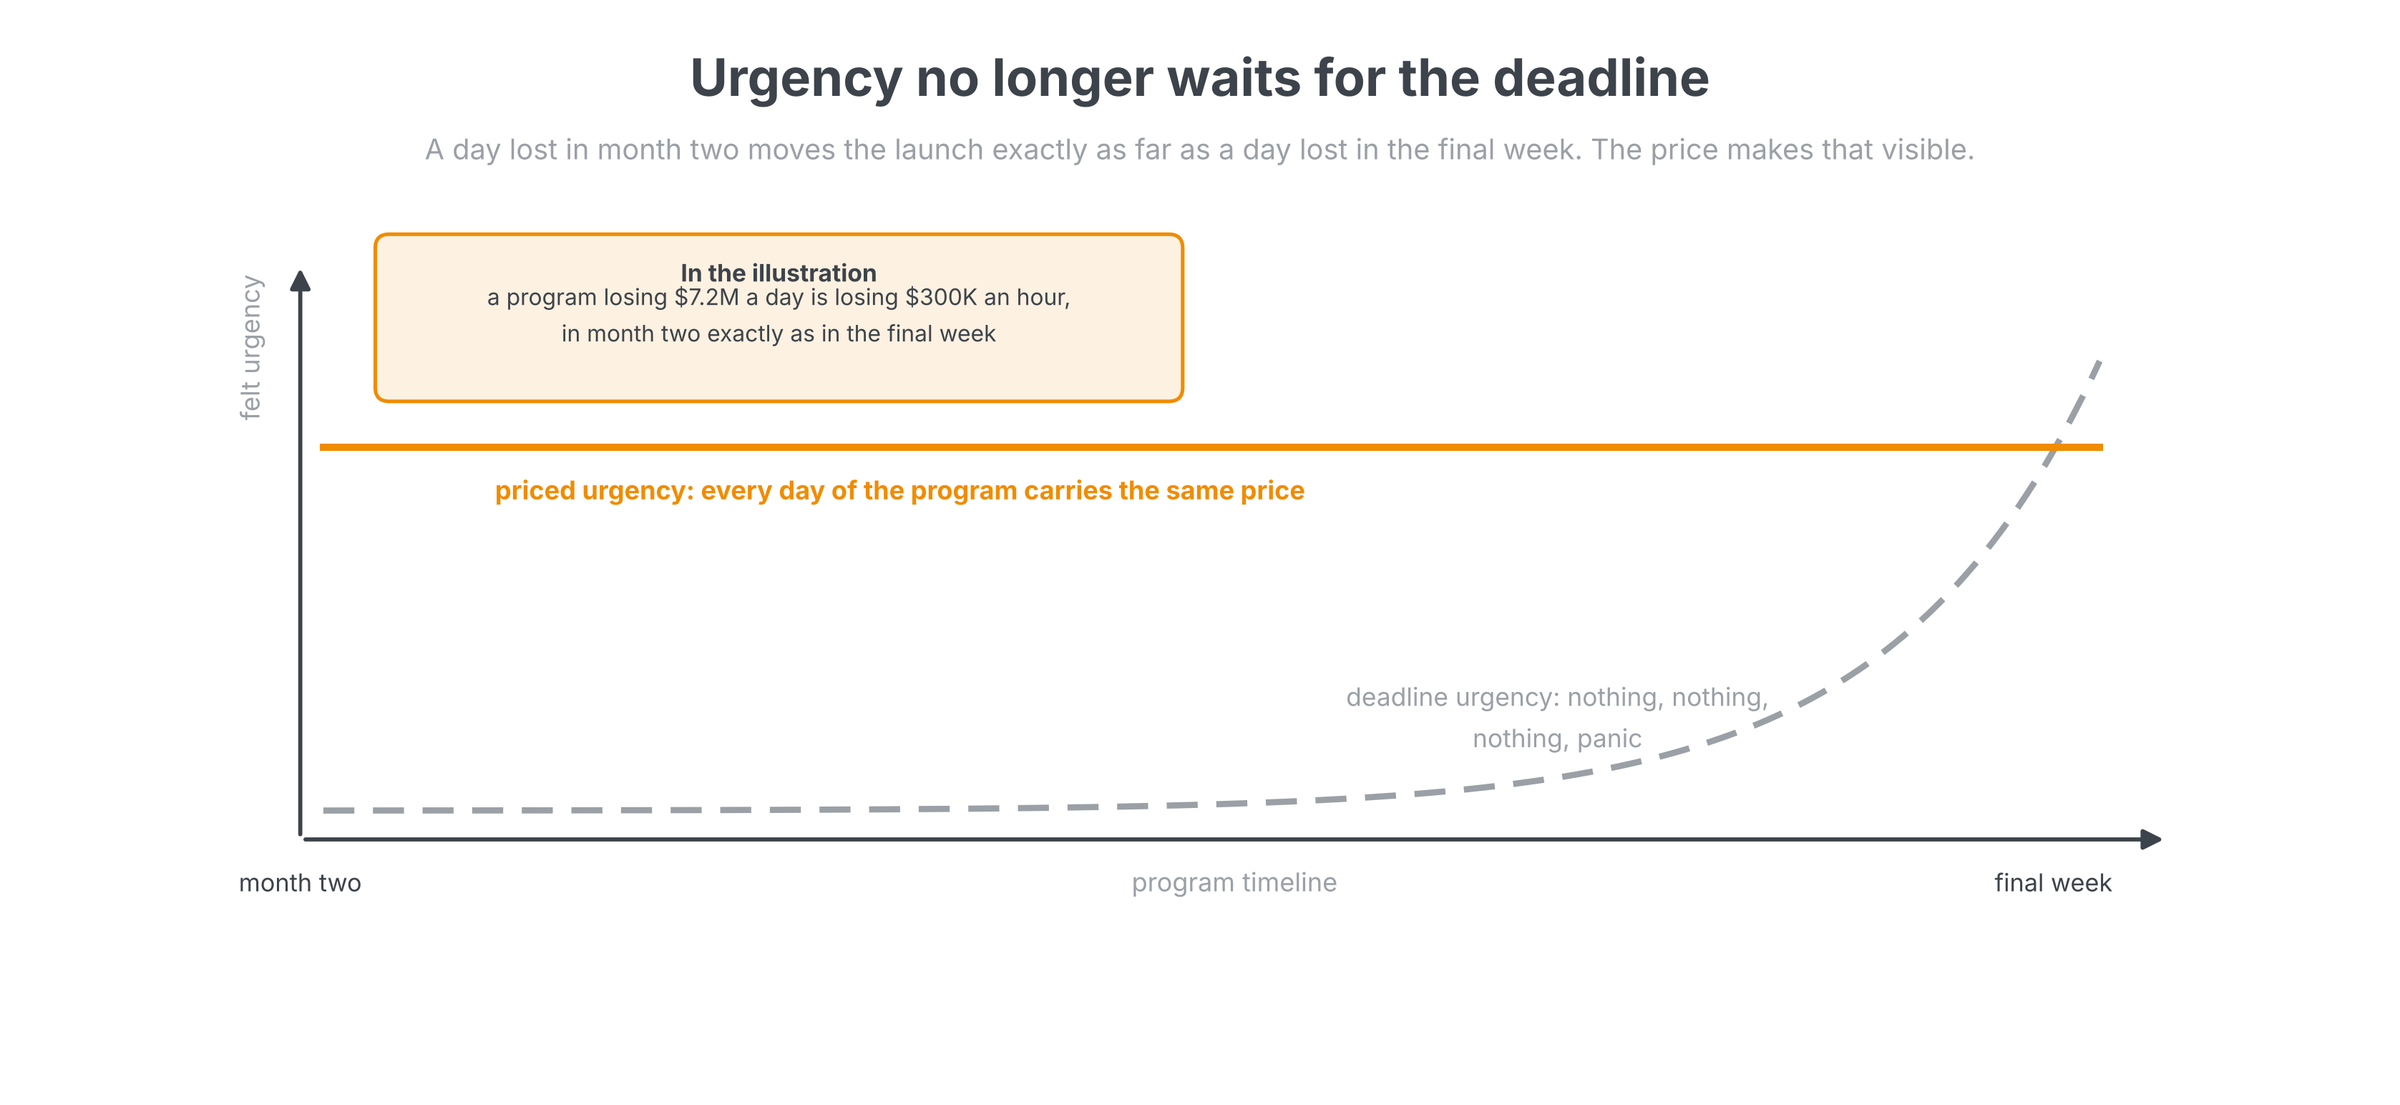
Deadlines create urgency late. A team eighteen months from its target feels little pressure in month two, yet a day lost on the critical path in month two moves the launch exactly as far as a day lost in the final week. The cost of delay makes that visible. In the illustration, the largest program loses $7.2 million for every day it slips, about $300,000 an hour, and the price is the same in the first month of the program as in the last. Three days of delay cost that program as much as its entire $21 million R&D budget; a decision that waits a week for the next meeting costs $5.5 million. This is why the practice is written at the level of the individual contributor: an engineer who knows the figure treats a two-day wait for a license or a review differently, and so does the manager who can remove the wait.
One caution, because the number invites false precision: a cost of delay is an estimate built on a forecast, and a figure can move several-fold when a team changes its view of the customer's window. The answer is not to abandon the model but to refresh it, print the assumption next to the figure, and compare programs on a common basis; the dashboard does all three. Judgment without a model does far worse. Reinertsen reports that intuitive estimates of cost of delay differ by 50 to 1 inside the same team.
"If you only quantify one thing, quantify the cost of delay."
Don Reinertsen's rule. The schedule tells a team how many days are at stake. The model tells the team what those days are worth. A team that knows both does not wait for the deadline to feel urgent.
Price the day
Start with one program: one business case, one delayed case, built with the product boss, marketing and engineering in the same session, so everyone works through the logic of the market window together. If lateness cannot be quantified at all, that is a finding too; the target date may not be the real need date. The portfolio page comes from repeating the exercise on each program and holding the teams to a monthly refresh, and the paper below walks through the six steps. However it starts, the destination is the same: delay has a price, the team knows it, and the work stops waiting for the deadline to feel urgent.
Related on lateralworks: Cost of delay and Targets and trends.
Downloads
- What a day is worth — the full paper, with the method, the evidence and the six steps (PDF)
- The cost of delay executive dashboard — nine-page illustrative example (PDF)