Every board meeting has a slide for them. Cost reduction, systems consolidation, a quality overhaul, the margin program the investors asked for. The board requested these improvements, the board wants to know their progress, and the board wants to know when the benefits land on the bottom line. And in most companies the CEO walks into that meeting with anecdotes, because the initiatives were staffed the way initiatives always are: assigned to capable people who already have full-time jobs.
That is the structural problem with corporate initiatives, and it is worth stating plainly. The work is critical, but it is nobody’s day job. The people carrying it are the same people running the business, so the initiative gets the hours left over after the “real job” is done, which most weeks rounds to zero. Nobody planned it, so nobody can say when it finishes. Nobody refreshes a schedule, so nobody knows it is slipping until the quarter is gone. The research says this is the norm, not the exception: PMI’s Pulse of the Profession found that only 56 percent of strategic initiatives meet their original goals, with organizations losing 109 million dollars of every billion spent on projects. An Economist Intelligence Unit study with PMI found 61 percent of firms struggle to bridge strategy formulation and implementation. HBR Analytic Services found only one fifth of organizations achieve even 80 percent of their strategic targets. The strategy is rarely the problem. The execution model is.
Treat initiatives as projects
The fix is not heroics and it is not more meetings. It is a decision to treat initiatives as what they are: projects with measurable outcomes. Each one gets an owner who drives it to completion, a schedule with milestones, and a target tied to the benefit the board asked for. The schedules are not complex. But even a 50-task project needs tracking, and when you add up ten initiatives you have many things in motion.
The staffing model is where the day-job problem actually gets solved. Each initiative gets a leader with the subject-matter expertise, and that leader keeps their operating role; you are borrowing their judgment, not their calendar. What gets added is professional project management: one full-time PM can run five to ten initiatives, depending on scope, statusing every schedule weekly and managing the critical paths. That single dedicated person is the difference between a portfolio and a wish list. It also respects what our research on project load has shown for decades: people spread across five efforts make real progress on none of them, so the model concentrates the coordination burden in the one role built to carry it.
A cadence that produces its own reporting
Accountability is not a personality trait. It is a cadence. Every initiative schedule lives in fastProject, statused weekly in the sixty-minute refresh, and the reporting generates itself from there: we built Claude skills that read the schedules and produce the program’s operating documents, so nobody writes status. Three artifacts run the system, and all are attached below as illustrative examples with identifiers removed.
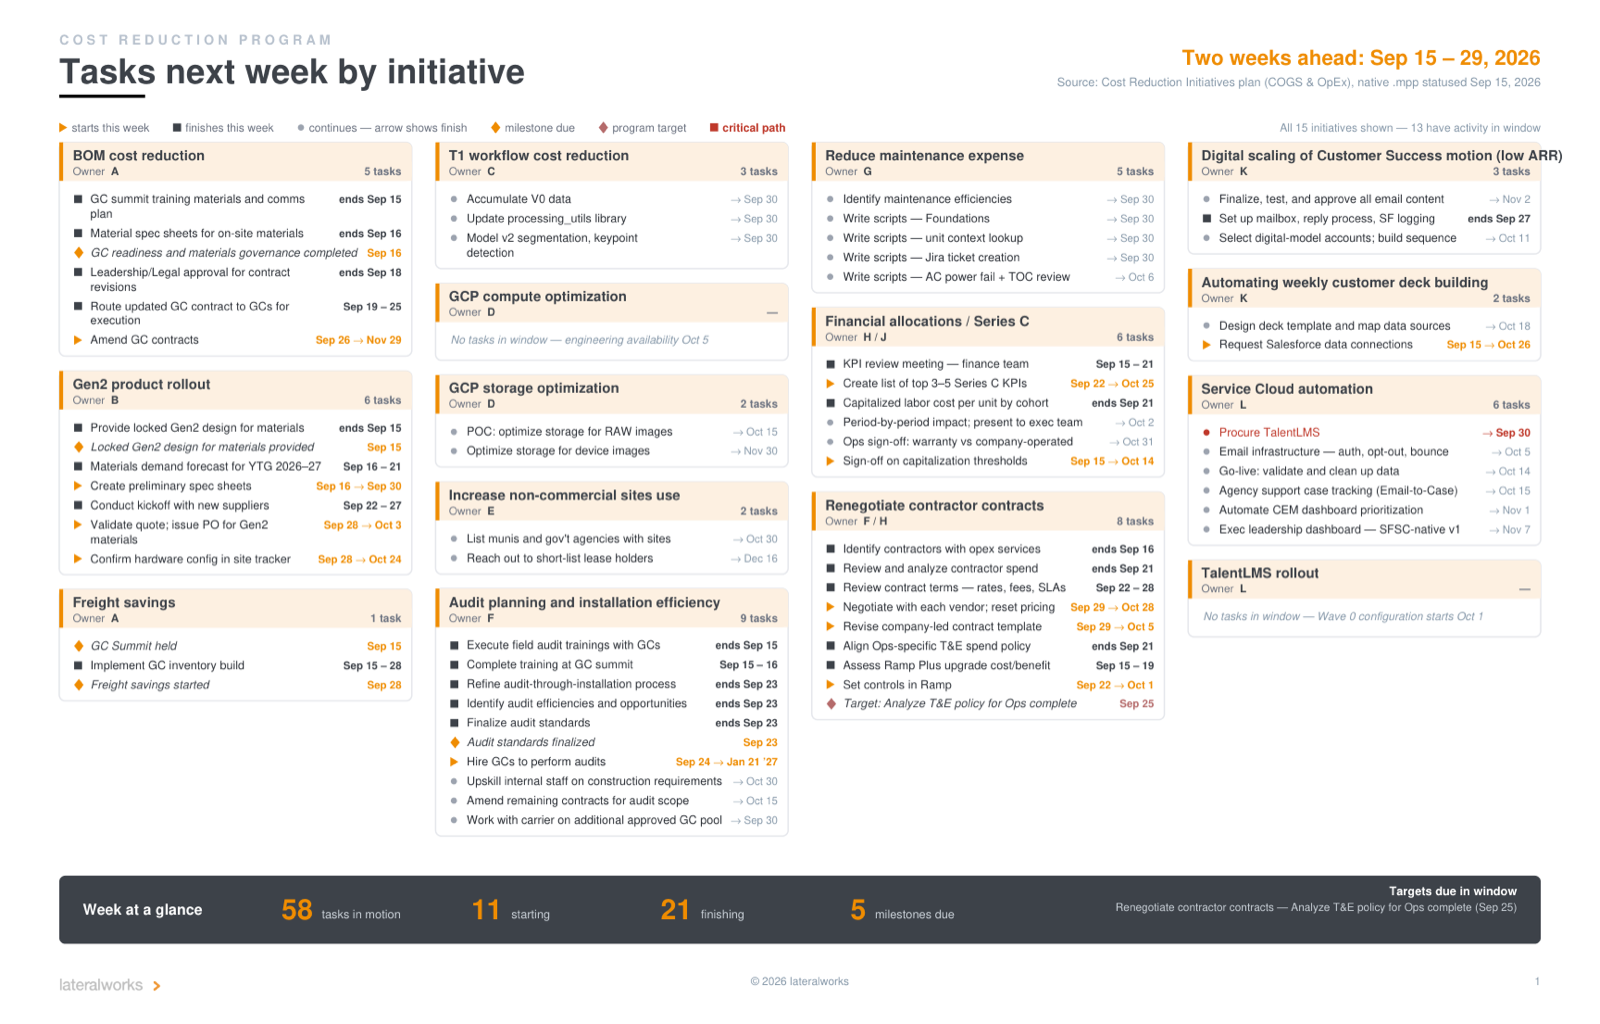
The weekly task view answers the ground-level question: what did each owner commit to in the next two weeks, initiative by initiative, straight from the plan.
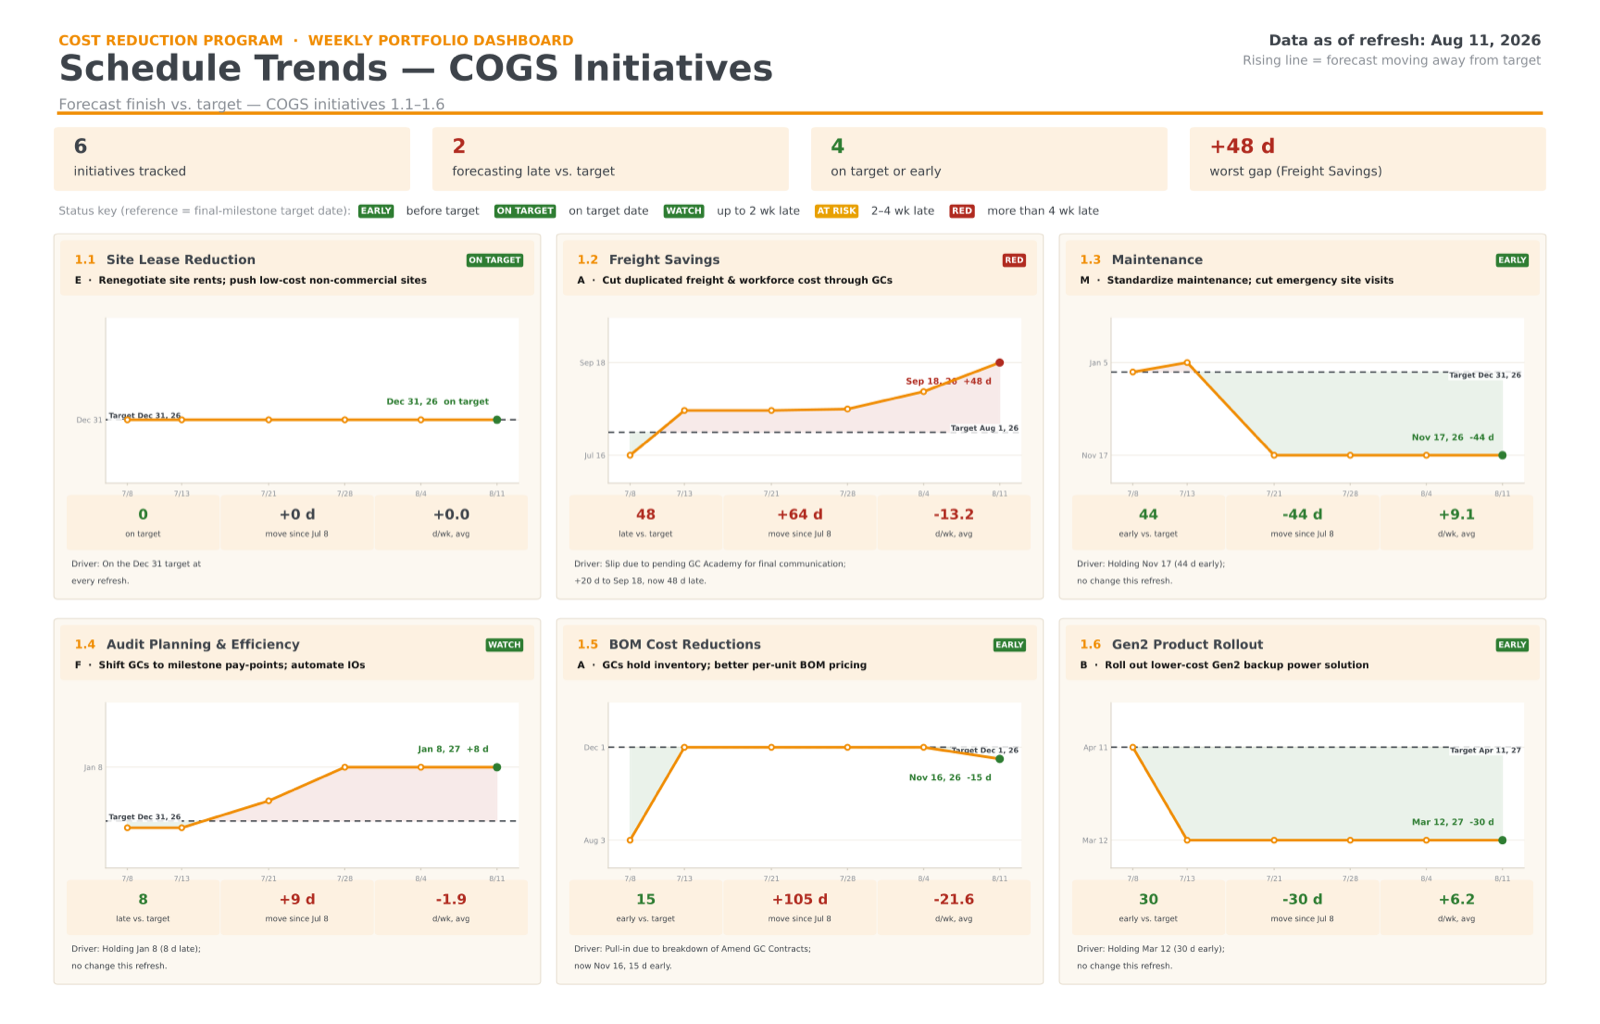
The trends dashboard answers the portfolio question. One wigglechart per initiative, forecast finish against a fixed target, status bands from early to red. In the example, six COGS initiatives: four on target or early, two forecasting late, worst gap 48 days. An executive reads it in one pass.
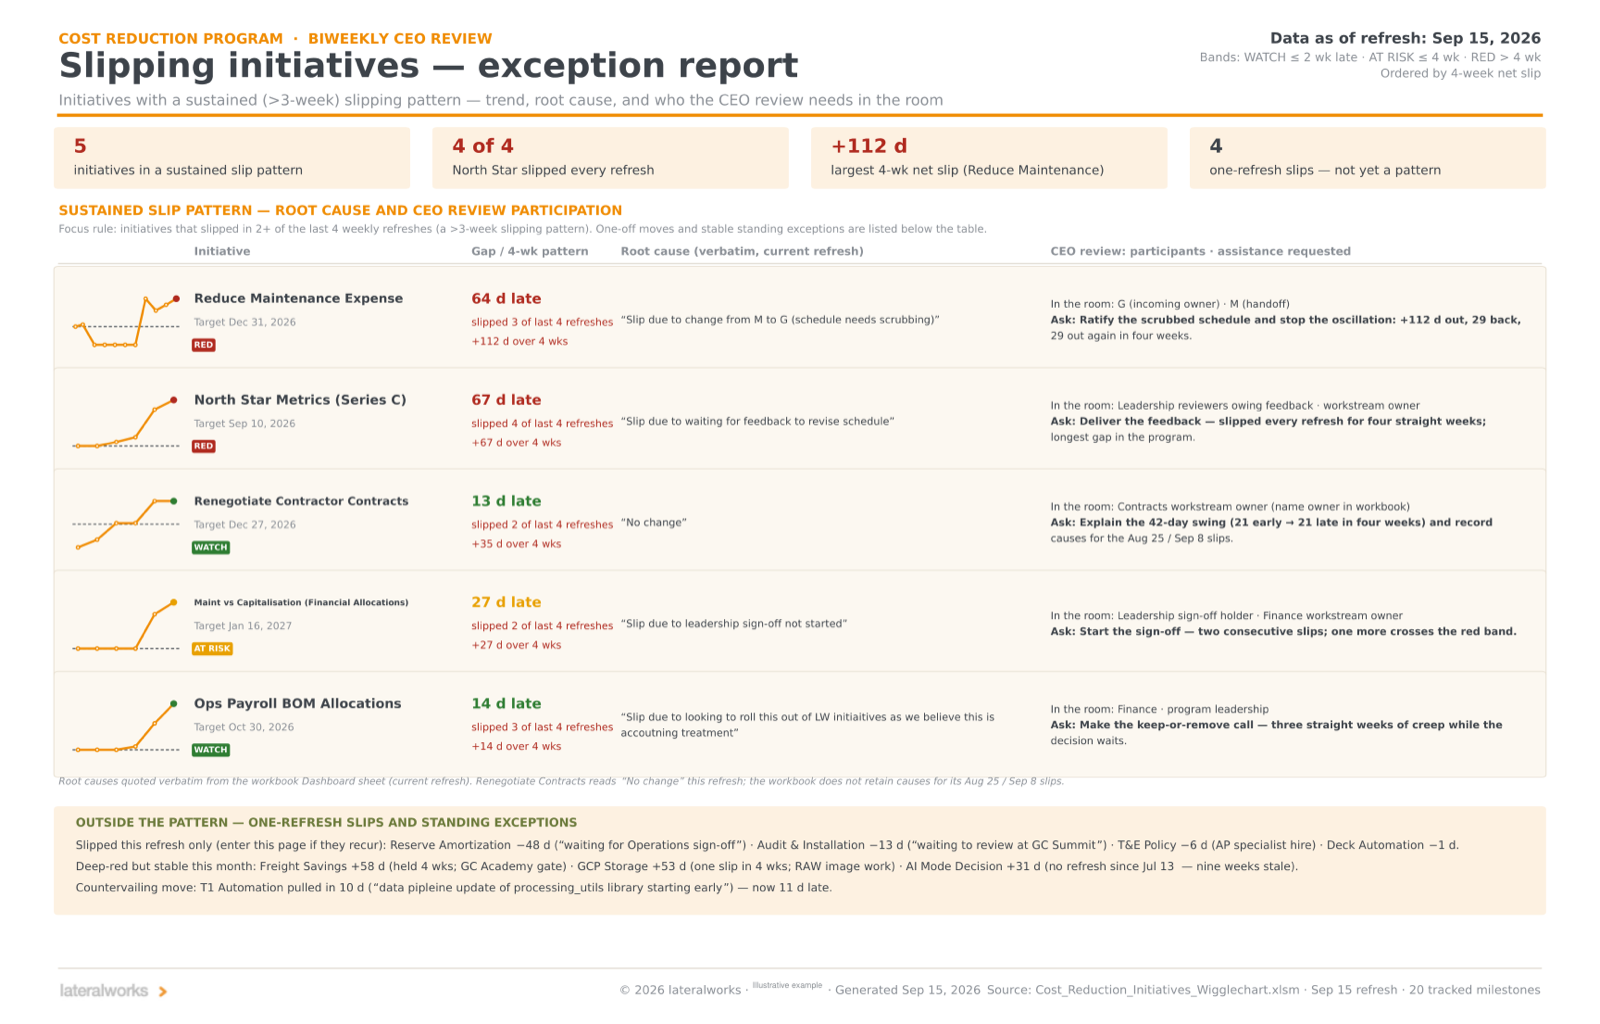
And the exception report answers the CEO question. It applies aggregate-then-drill-down to initiatives: only the ones with a sustained slipping pattern, more than three weeks of slip across the last four refreshes, with the root cause quoted verbatim from the workbook and, critically, who the CEO review needs in the room. One initiative in the example slipped every refresh for four straight weeks because it was waiting on leadership feedback. That row does not name a struggling team. It names a waiting decision, and the person who owes it.
Track the benefits like the schedule
The schedule tells you when. It does not tell you whether the money is showing up. Any improvement program should carry metrics tracked exactly like its execution schedule: each initiative gets a dollar target and a date alongside its milestones, and the realized and forecast run-rate plot against the target as a trend, on the same weekly cadence. A shortfall reads early, while there is still time to act on it, instead of at year-end when the benefit was supposed to be on the bottom line.
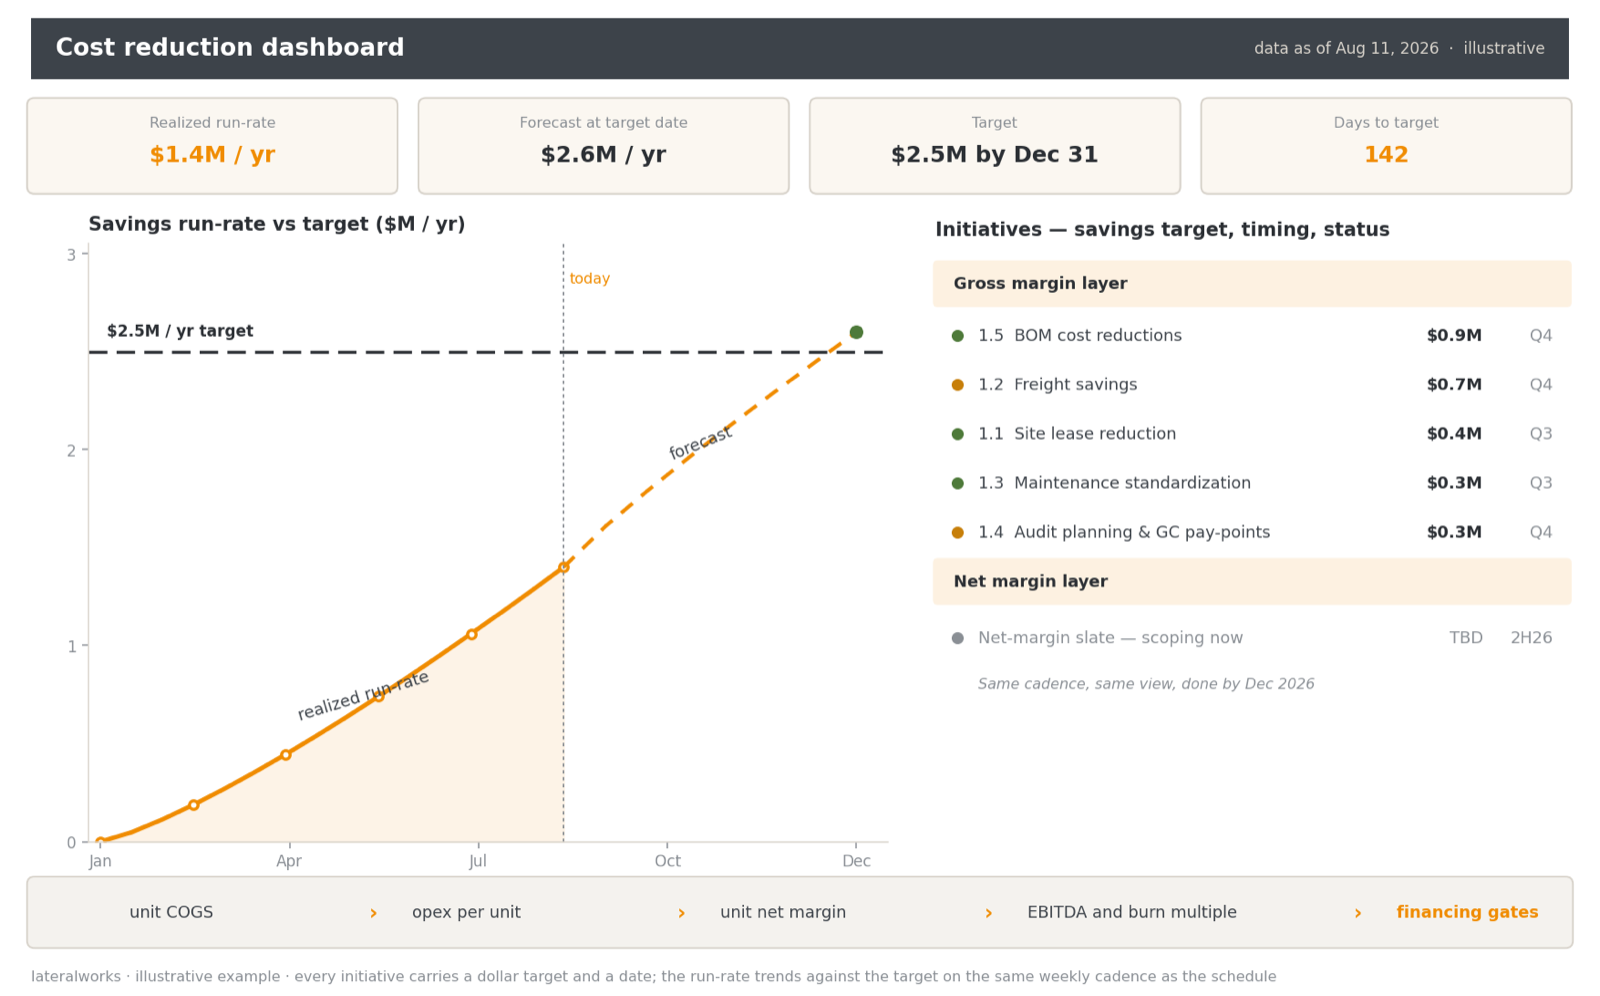
The dashboard is the money view of the program shown above. Same initiatives, same refresh date, two questions answered side by side: the schedule wigglechart says when each initiative finishes, and the run-rate trend says what it is worth and whether the savings are arriving. The two views disagree sometimes, and that disagreement is information. An initiative can hold its schedule while its savings estimate erodes, or slip its dates while the realized run-rate holds, and either way the trend surfaces it weeks before a quarterly review would. A CEO reports both views, because the board asked for both: progress, and money.
What the CEO reports to the board
This is the answer to the board question, and it is better than a status deck because none of it is composed. The targets are tied to the benefits the board asked for, so “when will it be done” and “when do the savings land” are the same date. The trends show direction of travel against targets that do not move, so a slip is visible the week it forms rather than the quarter it lands. And the exception discipline means the CEO spends the board’s time on the five initiatives that need decisions, not the fifteen that are fine. The same instrument runs the weekly portfolio review and the board meeting; the board simply sees the trend.
It scales: the Schwab example
The discipline is the same at any size. Charles Schwab’s IT infrastructure rationalization arrived as a 400-project backlog with projected savings of 15 to 25 million dollars a year and no sequenced path to any of it. Applying the same structure, initiatives as projects, a prioritized portfolio, integrated plans, and financial visibility on every one, realized 8.8 million dollars in annual run-rate savings within 18 months while consolidating the server fleet from 1,100 to 400. Roughly half the projected savings, captured in a year and a half, because the program stopped being a backlog and became a schedule.
Initiatives stop being an afterthought when they stop being side work. An owner, a plan, a target tied to the benefit, and a weekly refresh that tells the truth. The board asked when. The wigglechart is the answer.
References: PMI, Pulse of the Profession: The High Cost of Low Performance, 2014. PMI and the Economist Intelligence Unit, Why Good Strategies Fail: Lessons for the C-Suite, 2013. Harvard Business Review Analytic Services, 2019, as cited by PMI. Tabrizi, Lam, Girard, and Irvin, “Digital Transformation Is Not About Technology,” Harvard Business Review, 2019.
Related reading: Where targets come from, Portfolio schedule trends for the C-suite, The Weekly Schedule Refresh, Aggregate, then Drill Down, The Rhythm of Accountability, Targets and Trends, Ten numbers on two clocks, and The FTTM execution system.