In a recent planning workshop, an engineer on a client program looked at the first draft of a macro plan and raised an objection: this was "generated by AI," and the implication was that it might not be valid. The instinct behind the objection is fair, and it deserves a straight answer. But the plan was not generated from nothing. It was synthesized from the team's own documents, and that distinction changes how a team should read the draft. Teams that see machine-generated content set it aside. Teams that see their own data, reorganized for the next step, pick it up and start scrubbing. This article is about that distinction.
A year of decks
Some context makes the rest of this story mean more. The client had been working the program for a year with no schedule. The record was slide decks, built mostly around the business development side: the business case, the partners, the market. The development work itself ran through a network of independent contractors and remote employees, and there was never one integrated schedule, and no way to predict the end date. The team managed by setting deadlines: pick the date-constrained target, plan backward from it, and make the schedule fit. That produces arbitrary schedules that never finish on time, and it cannot predict the future or show the risks on the way to it.
The reframe
The first synthesized draft is where the "generated by AI" objection landed. Here is the same draft, described accurately:
What the draft actually is
This was synthesized from the documents you sent us into our FTTM macro planning structure, designed to start with the end in mind and work backward to the initial macro plan. As synthesized data, we will scrub it together for consistency and accuracy. The source of the data was your documents; the organization of the data is our format. The format makes it faster to transfer the data to the scheduling step.
"Generated" implies the machine invented content. Synthesized means something different: the team's own data, reorganized into a structure built for the step that follows. That is the whole use of AI in this work: synthesize, organize, and compare data rapidly in order to accelerate insight.
What AI changes
The time from unstructured data to insight is the cycle AI compresses, and nothing else about the method changes.
From the deck to the plan
The first pass started from the client's latest deck. The planning session synthesized it into the planning format, the milestone timeline first and the milestone matrix behind it, and scrubbed the result with the core team. It was mostly right, a few changes here and there. And organizing the material into a real critical-path structure changed what the team could see. The first schedule gap analysis existed, and it showed the program much later than the team expected. The interdependencies to internal and external partner funding were visible for the first time; slide decks cannot show them, schedules can. The structure also exposed what the decks were: strong business-case planning, weak development planning. Put through the FTTM planning structure, a business case became a real development plan.
Was the data right? No. Was it roughly right? Yes, and roughly right is good enough to fine-tune. The working image the team settled on is cutting a diamond: macro cuts first, then finer cuts, then polish. AI does the macro cuts. The creation step, the most time-consuming part of any plan, is exactly the step that gets handed over.
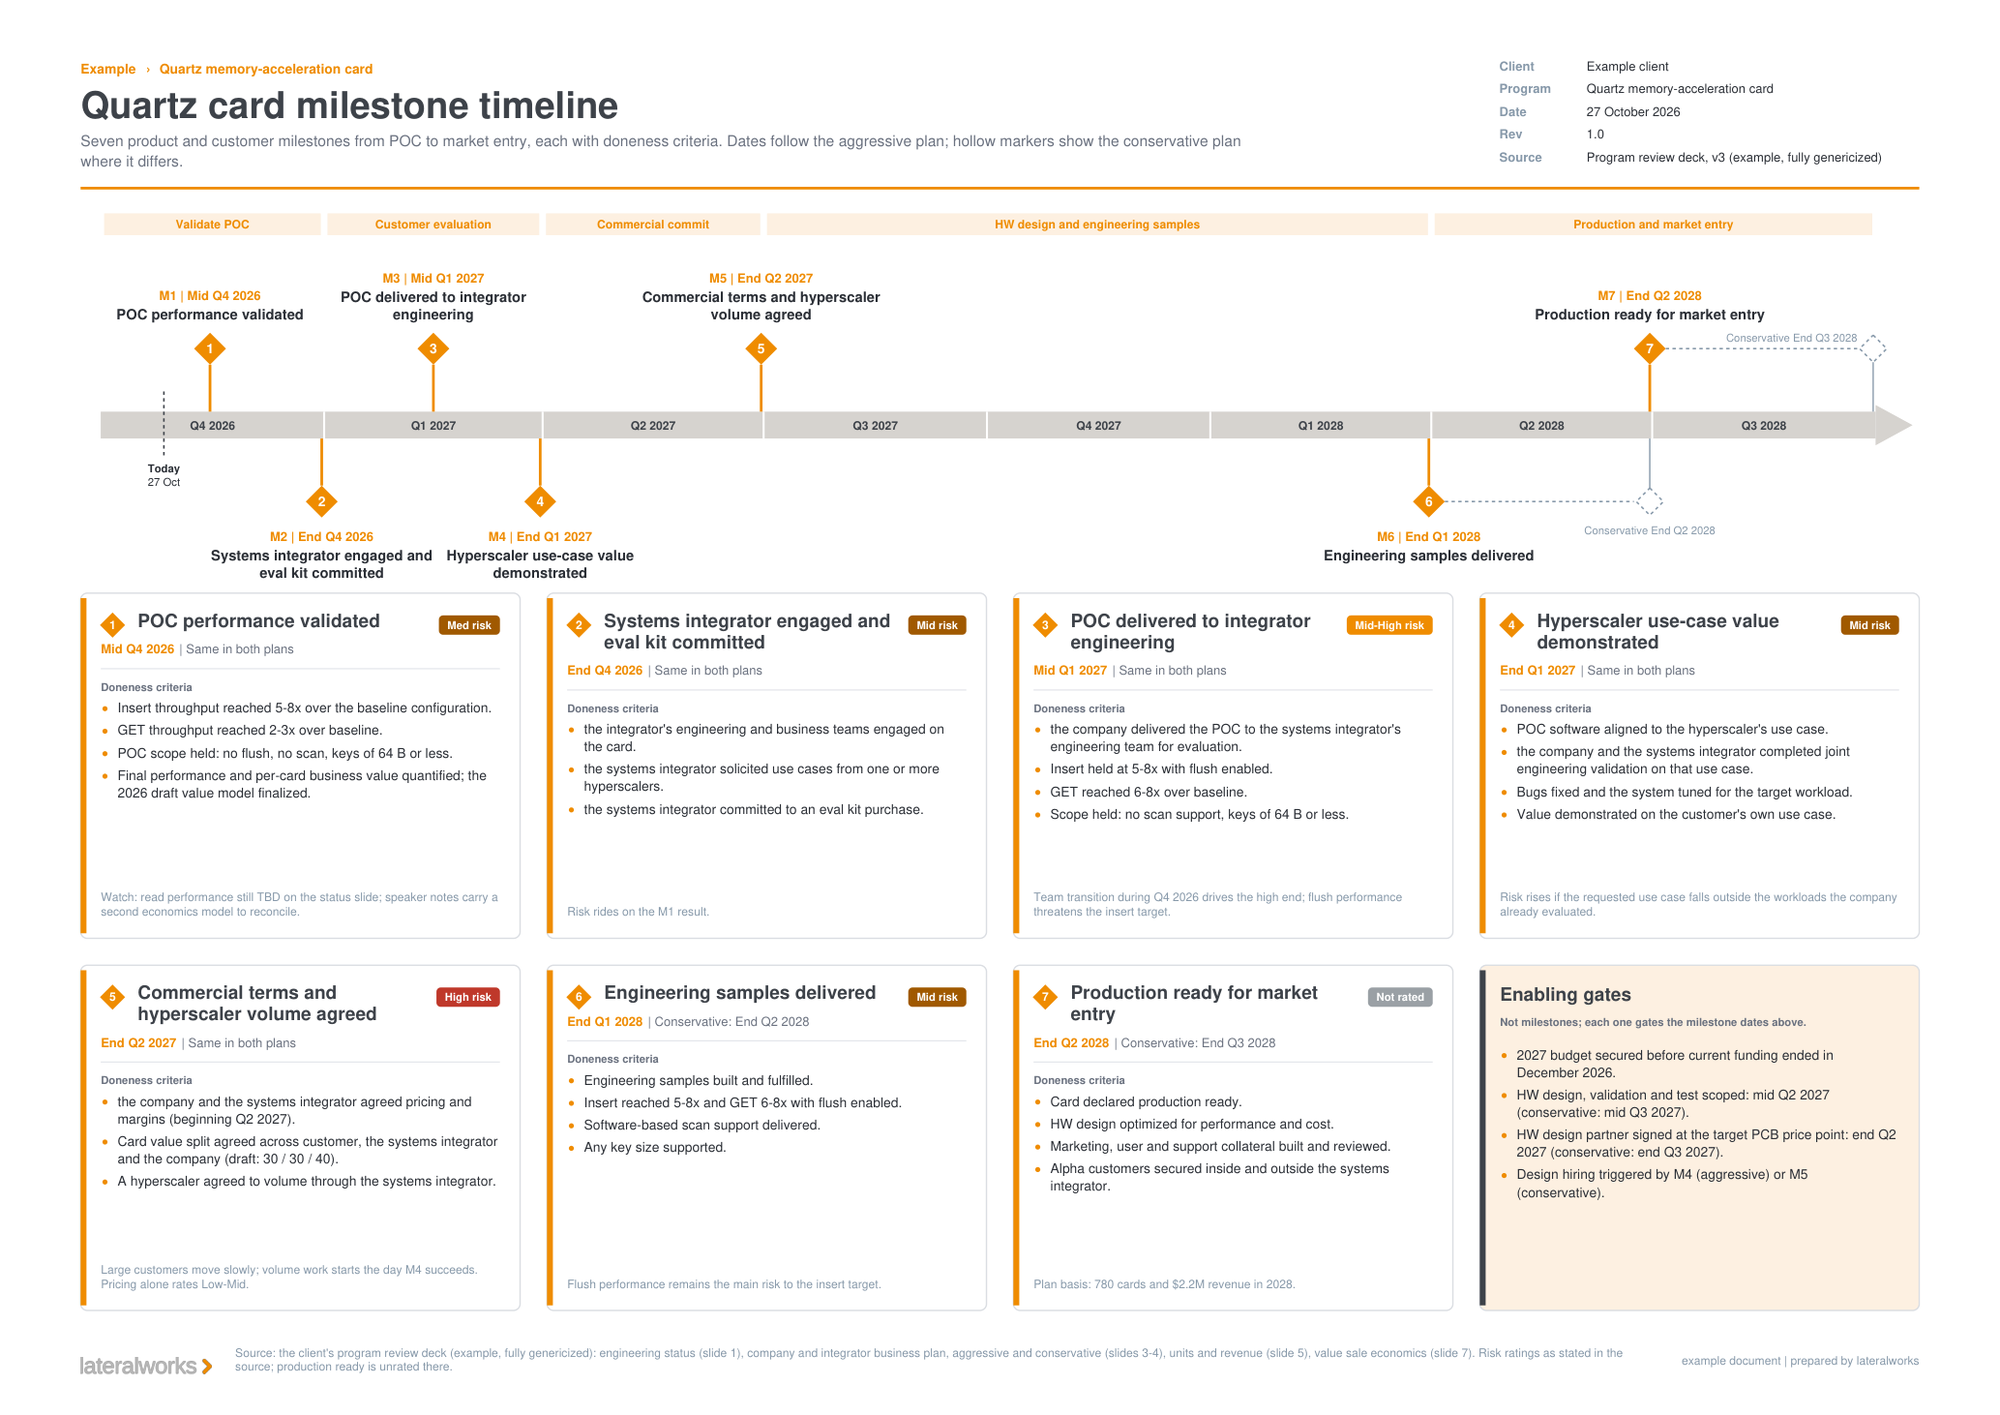
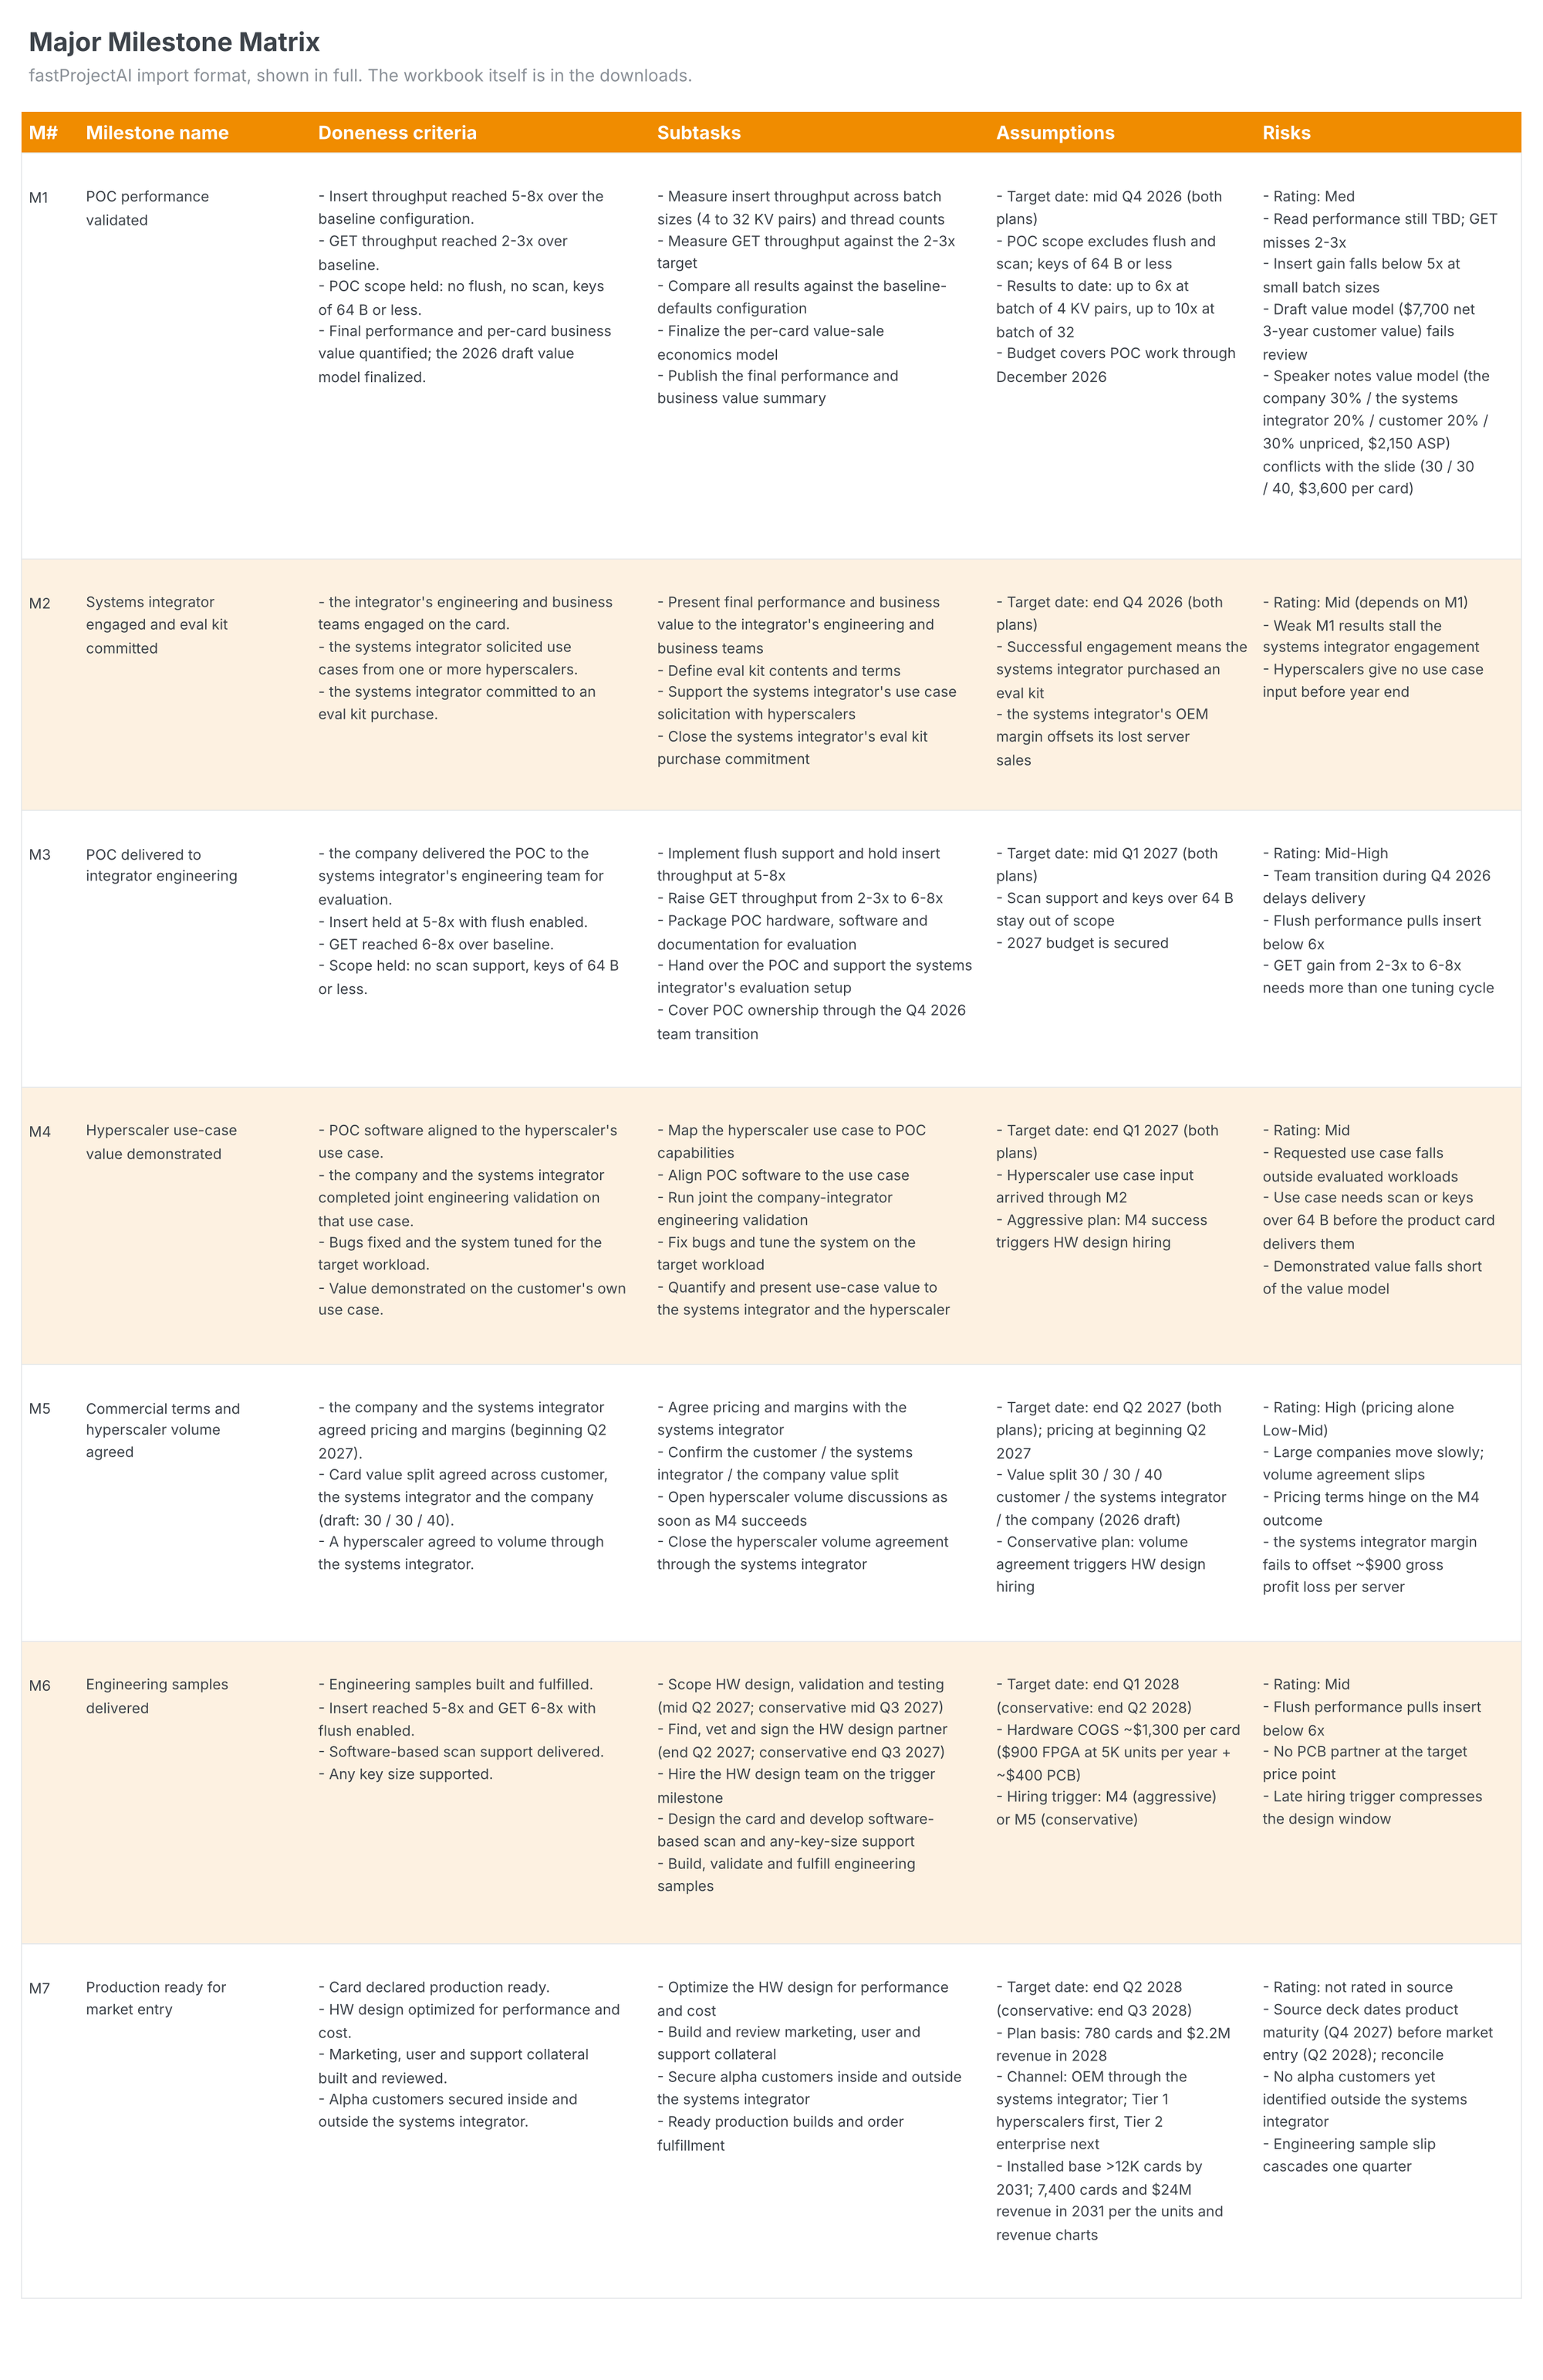
Behind the timeline sits the milestone matrix: every milestone with its doneness criteria, subtasks, assumptions and risks, in the exact format the scheduling tool imports.
Thirty minutes to a schedule
The matrix is not the end of the flow; it is the import file. Importing it into fastProjectAI generated the first schedule in thirty minutes, the first integrated critical-path schedule the program had ever had. The total time from receiving the deck to starting weekly refresh planning was two hours of workshops with the team. A year of planning by deadline, replaced inside a morning.
The draft finds the holes
The deeper answer to "generated by AI" is about the source data, not the tool. Human-generated planning inputs, the decks and side documents a program accumulates, are full of inconsistencies and small mistakes, and the assumption that the data starts out clean does not survive years of doing this work. Synthesizing those inputs into a predetermined framework did not generate false data. It showed where the source data had holes. On this very program, the per-card value split in the deck's speaker notes disagreed with the split on the slide, and the structured pass surfaced the conflict as a reconcile item instead of letting it ride into the schedule. That normalization is the first step of macro planning, not a side effect.
This case was an easy one: a single slide deck. The method gets more interesting, not less, when the sources of truth multiply, with chat threads, emails, meeting transcripts, spreadsheets and drawings all holding pieces of the plan that no one has merged.
Seven fast, then ten
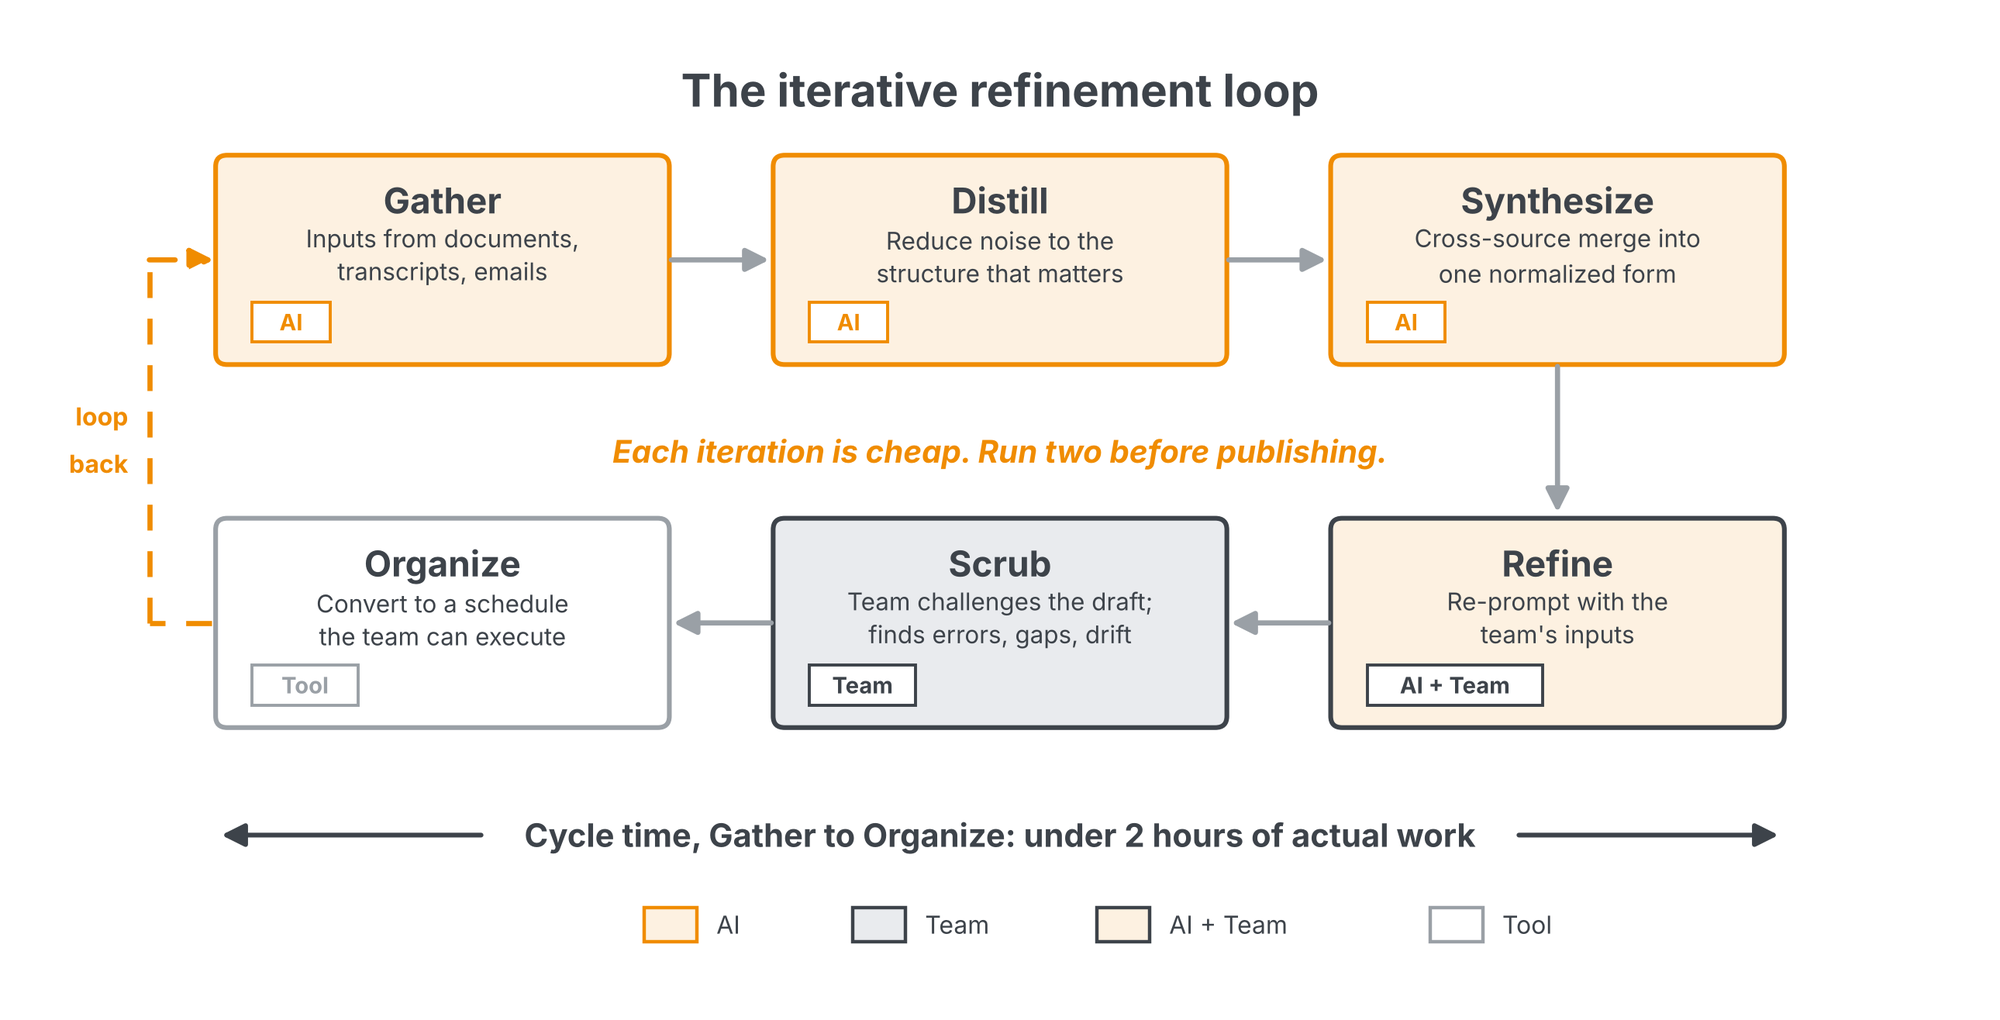
The working rule under all of this: if the goal is to get to 10, AI gets you to 7 fast, and the team scrubs from 7 to 10. The scrub is not validation theater. It is the human input the plan cannot ship without, the judgment and local context the model does not have. The case study puts the split at about 80/20, with three iterations of the loop usually enough to reach publishable.
The flow has since been packaged as a Claude skill that generates the milestone timeline and the milestone matrix automatically, ready for fastProjectAI ingestion. Feed it the raw material, slides, workbooks, documents, meeting transcripts, and web research including competitive analysis from the open internet, and it produces both artifacts behind a mechanical source-verification gate. Re-running this program's source deck through the packaged version reproduced the original session's milestone set exactly: seven milestones, same names, same dates, same risk ratings, fifty automated source checks passed. The only differences were two added bullets where the gated run caught figures in the speaker notes and charts that the original session had missed. The repeatable version is not just faster. It is more auditable than the hand-built one.
The full story, with the three-step flow, the iteration discipline and the research behind the 80/20 split, is written up in the case study Planning in three days, not three weeks. The artifacts below are fully genericized working examples of the two stage outputs: swap in your own documents and the same flow produces them for any program.
Related on lateralworks: One ODM, two schedules and The portfolio trends dashboard.